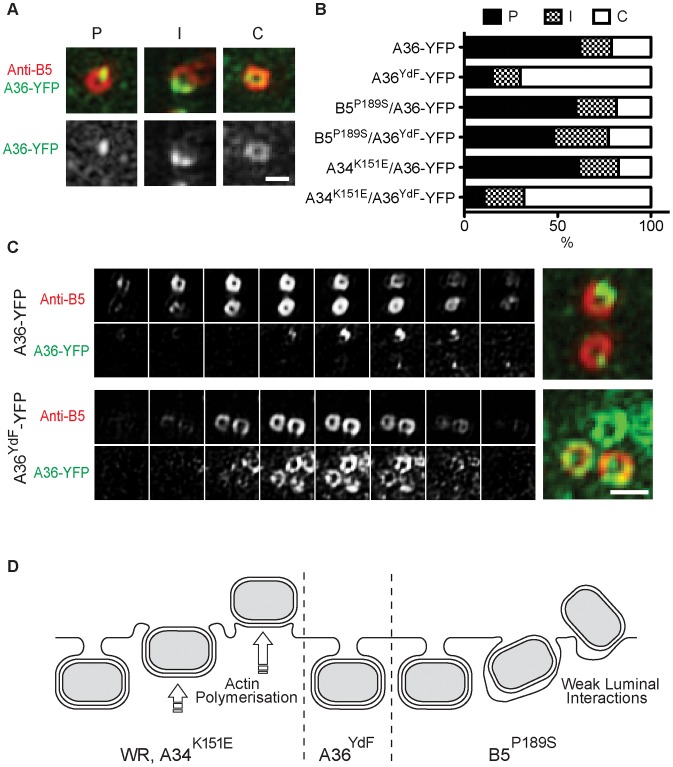
Figure 6. Quantification of polarisation of A36.
(A) Examples of the three categories for A36 distribution in 3D-SIM images: P = Polarised; I = Intermediate; C = Circular, and (B) percentage of viruses in each category for cells infected with A36-YFP, A36YdF-YFP, B5P189S/A36-YFP, B5P189S/A36YdF-YFP, A34K151E/A36-YFP or A34K151E/A36YdF-YFP. (C) Z-slices of representative A36 distributions in single A36-YFP and A36YdF-YFP virus particles. Scale bars = 0.5 µm. (D) Schematic of proposed events at the cell membrane for WR, A36YdF, B5P189S or A34K151E during egress.

