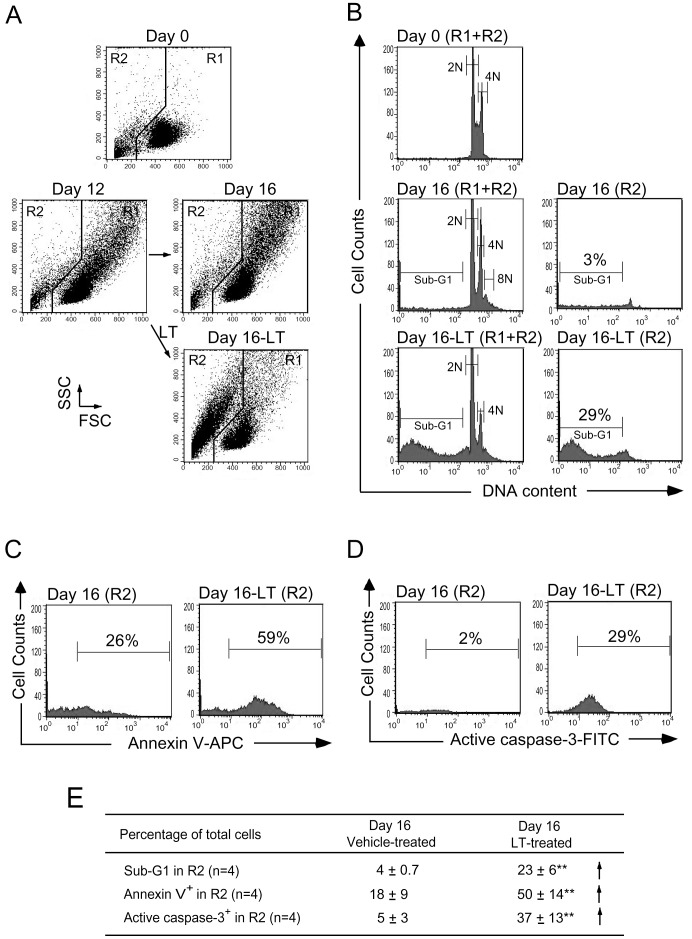
Figure 3. Characterizations of LT-induced hypoploid cells by apoptosis assay.
The expanded human cord blood-derived CD34+ cells (Day 0) were treated with LT on day 12 and then analyzed on day 16 in aforementioned 16-day differentiation courses of megakaryocyte. The cell size (FSC) and cell granularity (SSC) are indicated (A). Propidium iodine (PI) staining revealed the cellular DNA contents, in which the sub-G1 hypoploid cells were increased in LT-treated groups (B). AnnexinV-APC (C) and active caspase-3 antibodies (D) were used to investigate the apoptotic changes of LT-treated cells by flow cytometry. Summarized events were shown on (E). Data are reported as mean ± standard deviation (SD) and represent 4 independent experiments. **p<0.01 compared to vehicle-treated groups.

