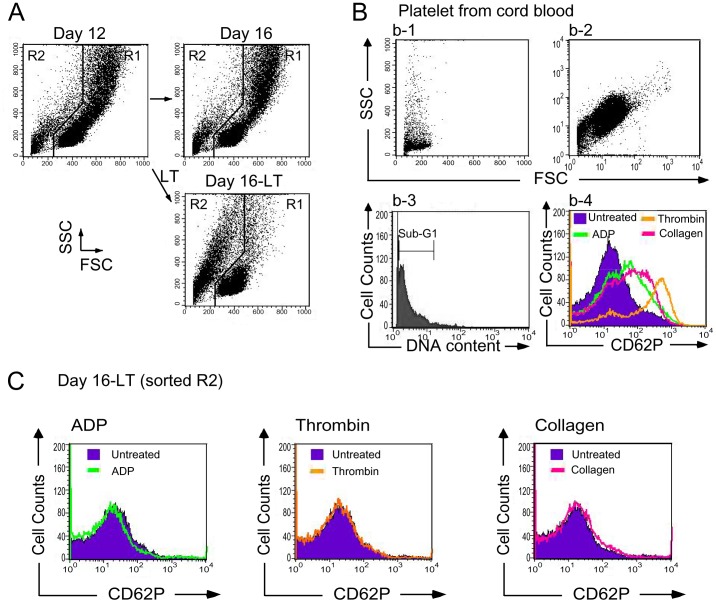
Figure 4. Characterizations of LT-induced hypoploid cells by platelet activation agonists.
Human cord blood-derived CD34+ cells were treated with LT on day 12 and then analyzed on day 16 in aforementioned 16-day differentiation courses of megakaryocyte. The cell size (FSC) and cell granularity (SSC) are indicated (A). Size (FSC) and granularity (SSC) parameters of cord-blood platelets were plotted as linear scale (b-1) and logarithmic scale (b-2). The cellular DNA contents were revealed by propidium iodine (PI) staining (b-3). Agonist ADP, thrombin, and collagen-induced stimulation of the platelets (b-4) versus cell sorter-enriched R2-cells (day 16, LT-treated groups) (C) was revealed by enhanced surface staining of P-selectin (CD62P), a platelet activation marker. These results obtained from 3 independent experiments.

