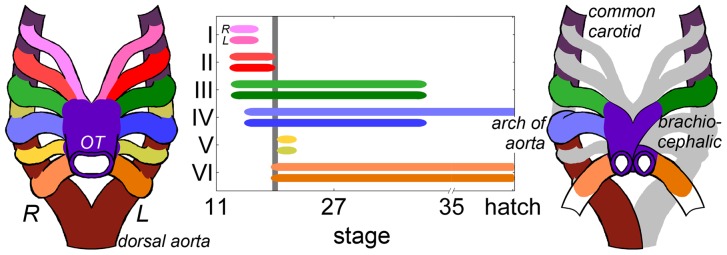
Figure 1. Timeline and schematic of the AA derivatives in the chick embryo.

The timeline depicts the duration of the connection between the heart and descending dorsal aorta, where line width is an approximation of the frequency that the AA is present. The time axis is skewed to highlight the early stages investigated in this study. Though AA V is included here, it never truly connects to the dorsal aorta. The gray line designates stage 21, where up to four AA can be present. The schematic on the right depicts the mature avian great vessel pattern, where gray represents embryonic AA sections that disappear prior to the final arch configuration.
