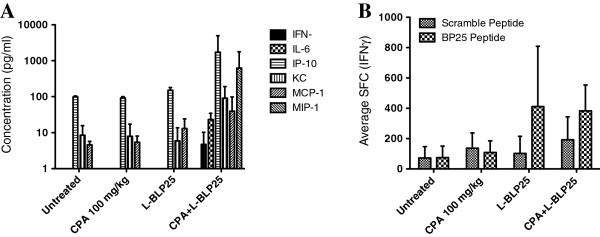
Figure 6.

IFN-γ immune response and Th1, Th2, and average inflammatory serum cytokine concentrations in the L-BLP25 two-cycle study. Luminex (A) and ELISpot (B) analyses were performed on four mice from each treatment group at the conclusion of the study (Week 41). Serum samples from individual mice were analyzed for the presence of 25 cytokines. For all analyses, n = 4. SFC = spot forming colonies. Error bars represent positive standard deviation.
