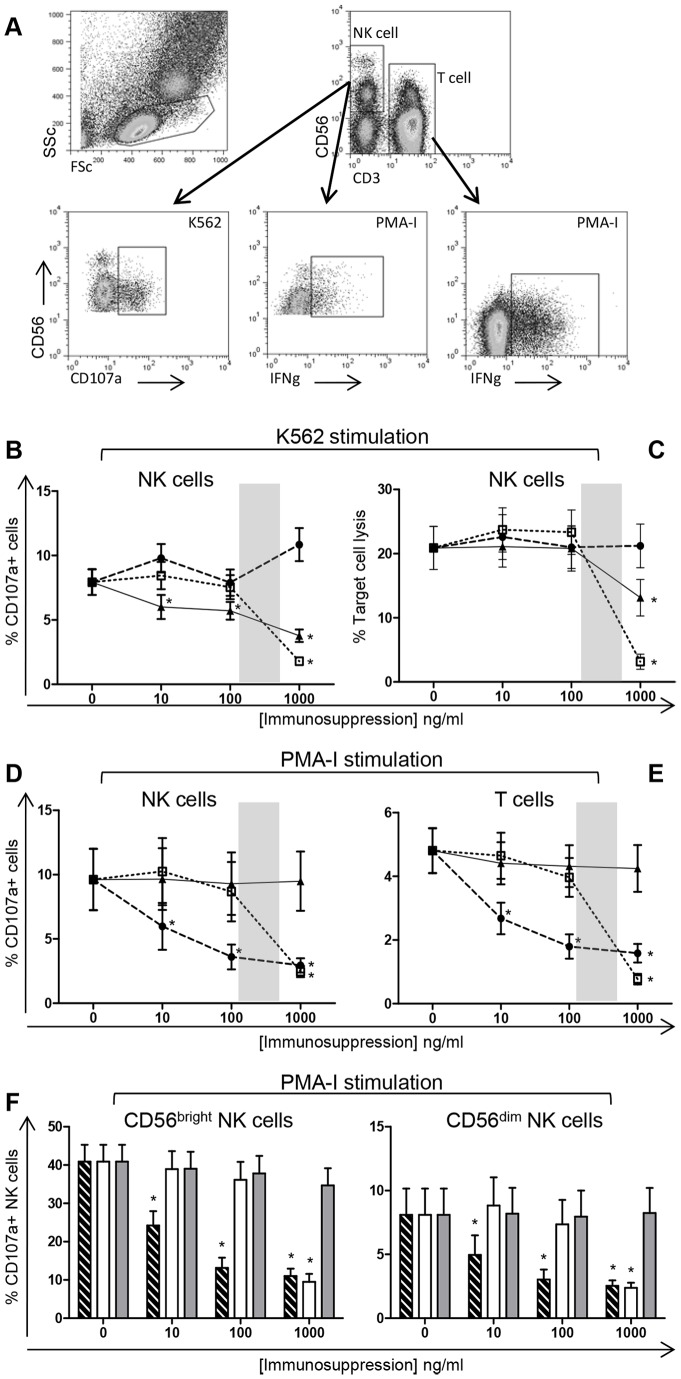
Figure 1. NK cell and T cell cytotoxicity in the presence of immunosuppressive drugs.
PBMC from 20 healthy controls were stimulated in culture with the cell line K562 or PMA-I in the presence or absence of varying concentrations of immunosuppressive drugs. An example of the flow cytometry gating strategy for identification of positive expression is shown (A). NK cell cytotoxicity measured by CD107a surface expression (B) and chromium release assay, at a 50∶1 effector-to-target ratio (C), in response to K562 stimulation. CD107a expression for whole CD56+ NK cells (D), T cells (E) and NK cell subsets CD56bright and CD56dim (F) measured following PMA-I stimulation. Statistical significance was defined as p<0.001. Graphed data are presented as mean ± SEM. Symbols represent immunosuppressive drugs: •, dashed bars: Cyclosporine A; □, white bars: MPA; ▴, grey bars: Prednisolone. Shaded areas signify therapeutic range.

