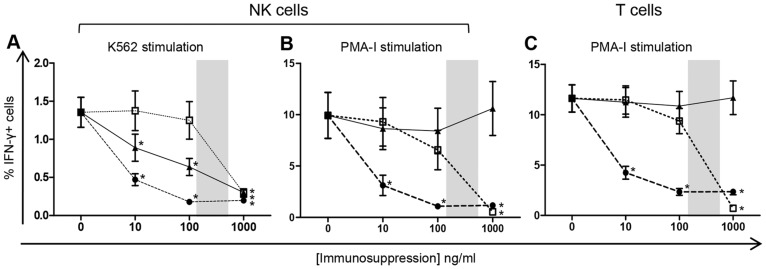
Figure 2. NK cell and T cell IFN-γ production in the presence of immunosuppressive drugs.
PBMC from 20 healthy controls were stimulated in culture with the cell line K562 or PMA-I in the presence of varying concentrations of immunosuppressive drugs. NK cell IFN-γ production measured in response to stimulation with K562 cell line (A) and PMA-I (B). T cell IFN-γ production measured in response to PMA-I stimulation (C). Statistical significance was defined as p<0.001. Graphed data are presented as mean ± SEM. Symbols represent immunosuppressive drugs: •, Cyclosporine A; □, MPA; ▴, Prednisolone. Shaded areas signify therapeutic range.

