
Figure 3. Proliferation of NK cells in the presence of immunosuppressive drugs.
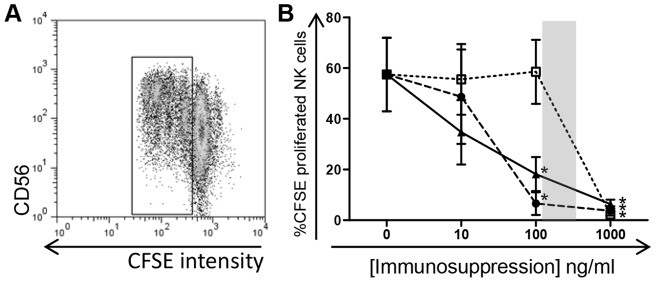
MACS enriched NK cells from three healthy controls were labelled with CFSE and stimulated in culture for three days with a combination of IL-2, IL-12 and 721.221 cell lines in the presence or absence of immunosuppressants Cyclosporine A, MPA and Prednisolone. An example of the change in CFSE intensity as the cells proliferate is shown (A). NK cell proliferation is displayed in response to treatment with varying concentrations of the immunosuppressive drugs (B, p<0.05 for all). Graphed data are presented as the mean ± SEM from three independent experiments. Symbols represent immunosuppressive drugs: •, Cyclosporine A; □, MPA; ▴, Prednisolone. Shaded area signifies therapeutic range.