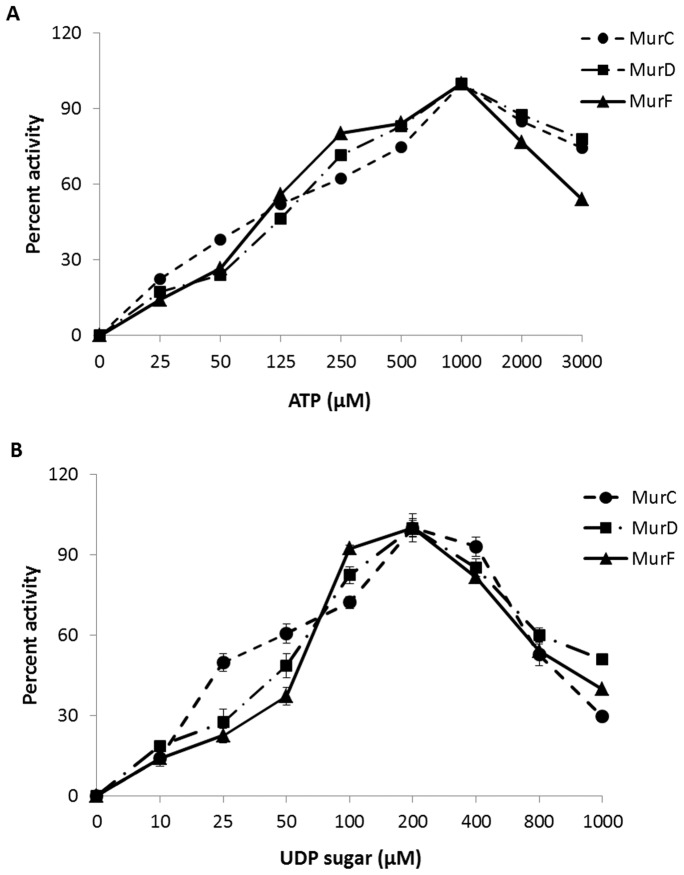
Figure 3. Estimation of optimal substrate concentration for Mur synthetases.
Inhibition curves obtained for MurC, MurD and MurF synthetases with (A) ATP and (B) their respective uridine sugars. X-axis represents substrate concentration used and Y-axis is the percent inhibition calculated for each concentration.

