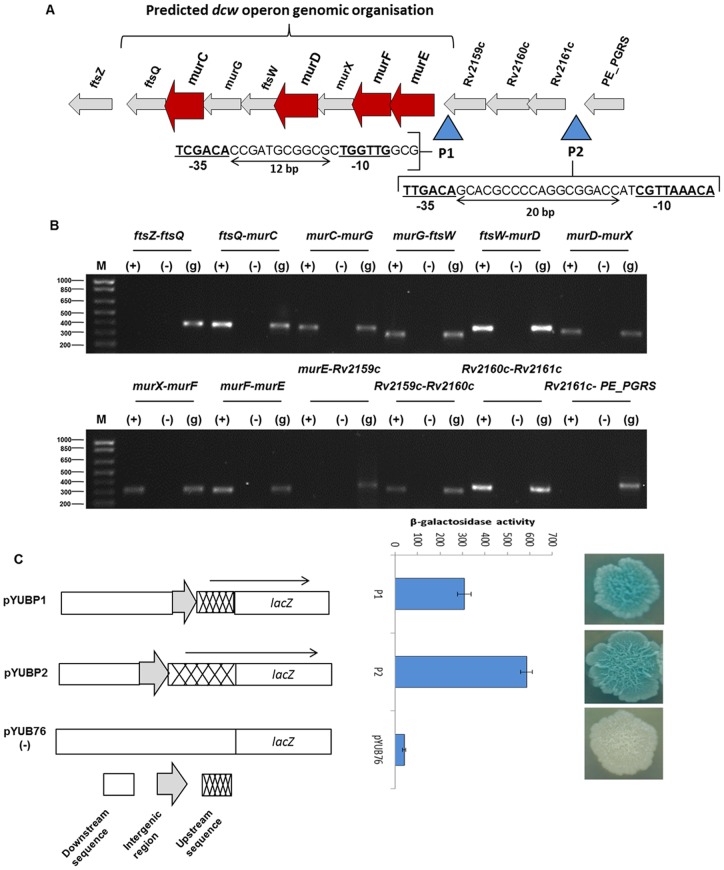
Figure 4. dcw operon analysis.
(A) Representation of the M. tuberculosis genomic region (2408385–2424838), showing ORFs and gaps, and highlighting regions upstream of the dcw operon screened for the presence of a promoter driving the operon. (B) cDNA analysis for identifying boundaries of the dcw operon. (C) Promoter analysis by cloning into the promoter-less vector pYUB76 and β-galactosidase assay for confirmation of promoter activity.

