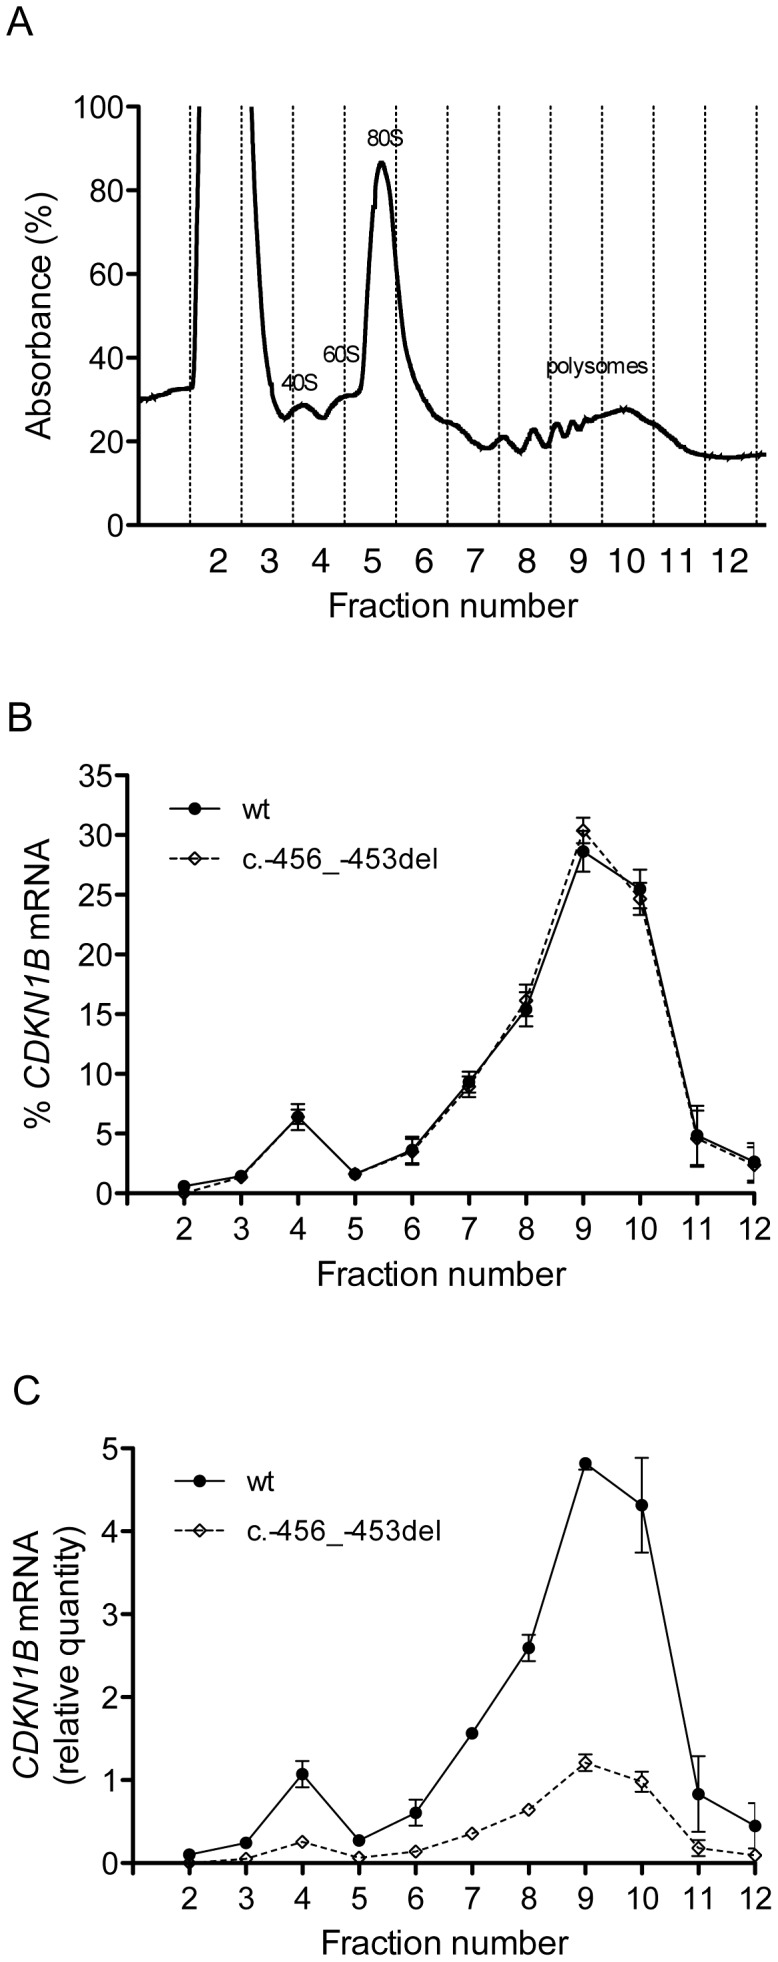
Figure 8. Polysome profiling of lymphoblastoid cells from the -456_-453delCCTT mutation carrier.

(A) Representative absorbance profile for RNA separated by velocity sedimentation through a 15–50% sucrose gradient. The positions of the 40S, 60S, 80S, and polysomal peaks are indicated. (B) The levels of CDKN1B mRNA (wt and c.-456_-453del) in each gradient fraction were measured by quantitative real-time PCR and plotted as a percentage of the total CDKN1B mRNA levels (wt or c.-456_-453del, respectively) in that sample. Data represent three independent experiments, with mean ± SD reported. (C) The levels of both alleles in each fraction were expressed as relative quantities calculated from differences in Cq values between mRNA and genomic DNA for removing the intrinsic variation between the two qPCR assays. Data represent the mean of three independent experiments ± SD.
