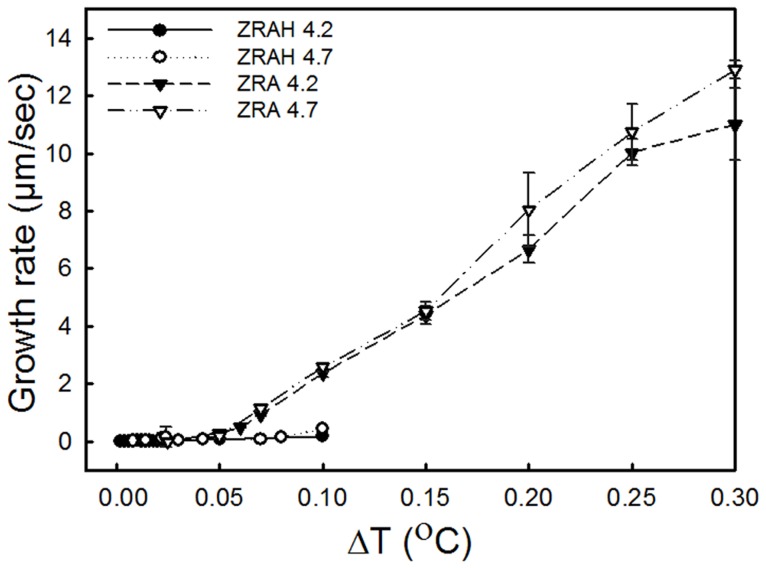
Figure 3. Comparison of the effects of ZRAH and ZRA on the ice growth rates along the c-axis.
The X-axis represents the temperature below Tm. The Y-axis represents the rate of growth of the radius of a seed ice crystal 20 µm in length. For ZRAH solutions, growth at ΔT >0.1°C could not be measured due to crystal orientation.

