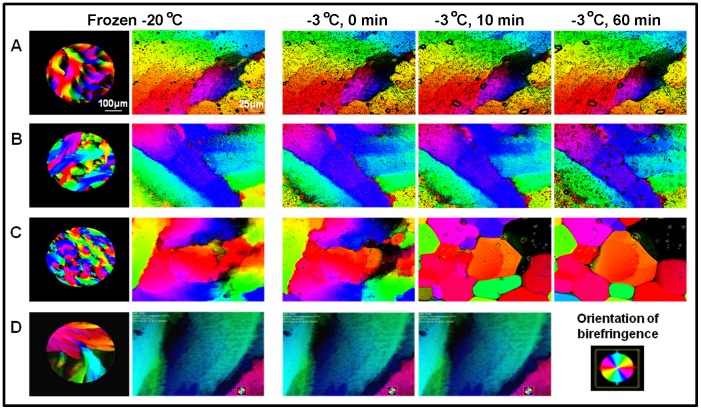
Figure 4. Ice recrystallization inhibition by ZRA and ZRAH.
LC-PolScope images for (A) ZRA at pH 4.2, (B) ZRAH at pH 4.2, (C) 100 mM sodium acetate pH 4.2 (negative control), and (D) AFP III (40 µM solution). The colors represent the optical axis orientations of the ice which was determined by the Abrio birefringence detection system. The color map in the bottom right corner corresponds to the respective birefringence orientation. The images in the first and second columns show the initial frozen state at 4× and at 50× magnifications, respectively. Images in the last three columns were collected at an annealing temperature of –3°C, at times 0, 10, and 60 minutes. Note the grain boundaries that appeared during annealing only in the buffer sample. These boundaries shifts indicate recrystallization process.

