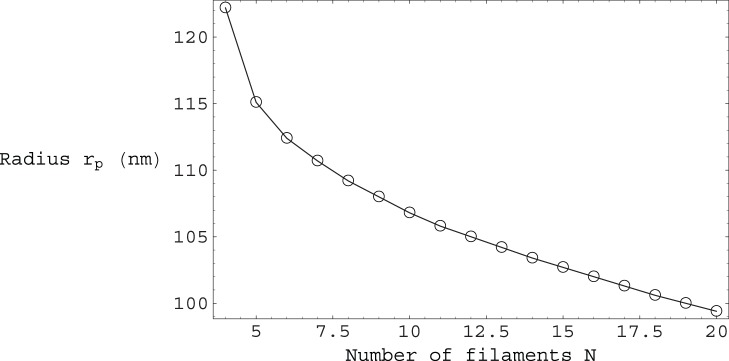
Figure 6. Plot of the polymer helical radius  versus the number of filaments
  .
.

The  values plotted correspond to the energetic minima of the total energy per unit contour length
  from Eq.(12), for a given number of filaments
  . For comparison, note that
  .
.
