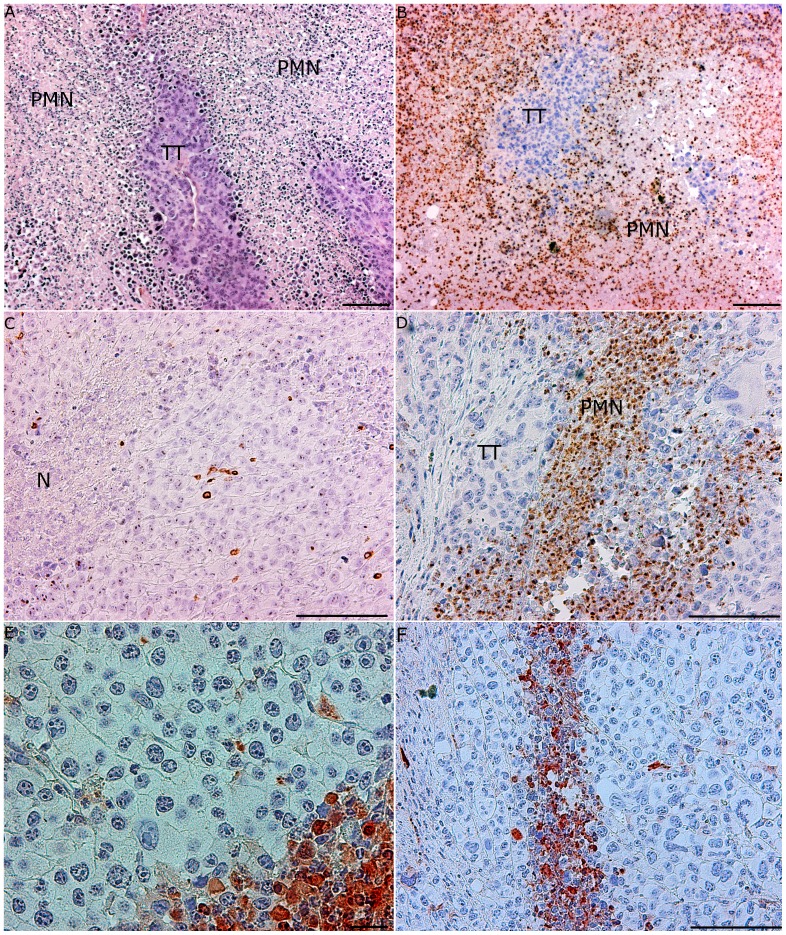
Figure 7. Massive infiltrations of PMNs and apoptotic areas in regressing tumor tissue 35 days after AT of SR/CR leukocytes depleted of CD4+/CD8+ T cells and B cells (representative sections, n = 6).
(A) Large necrotic areas with PMN infiltration (PMN) and clearly marked borders between vital and necrotic tumor tissues (TT) (HE stain, bar 100 µm). (B) The necrotic areas showed dense infiltration by PMNs (PMN) (myeloperoxidase staining, bar 100 µm). (C) CD3+ T cells were more sparsely distributed in the tumor tissue and were not found in areas with necrosis (N) (CD3 staining, 20x magnification). (D) PMNs (PMN) infiltrating the tumor tissue (TT) in trabecular formations (myeloperoxidase staining, bar 100 µm). (E) Many of the tumor cells were highly positive for caspase-3 (arrows) indicating apoptosis (caspase-3 staining, bar 20 µm). (F) The distribution pattern of the apoptotic cells had a trabecular formation, which resembled the distribution pattern of the PMNs in the tumor tissue in D (caspase-3 staining, bar 100 µm).

