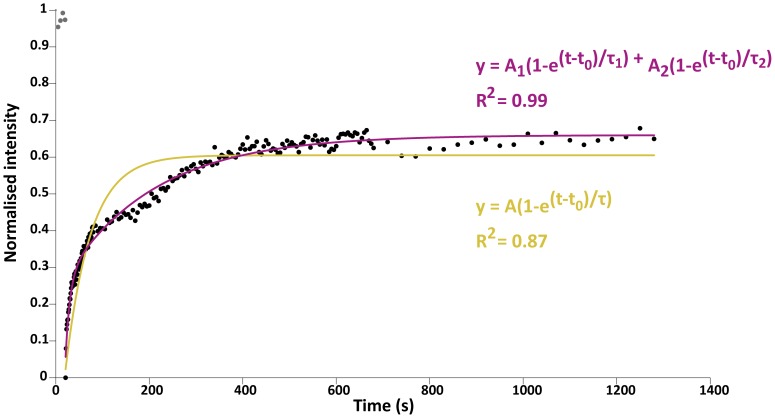
Figure 3. Double exponential fits better describe the FRAP data.
FRAP recovery curve of a DE-CadherinGFP experiment with the newly developed imaging protocol with two different fitting curves and their parameters. Normalised raw data (black); single exponential fitting curve (yellow) and double exponential fitting curve (purple). The different curve fitting equations are shown as well as the fit correlation with the raw data (R2).

