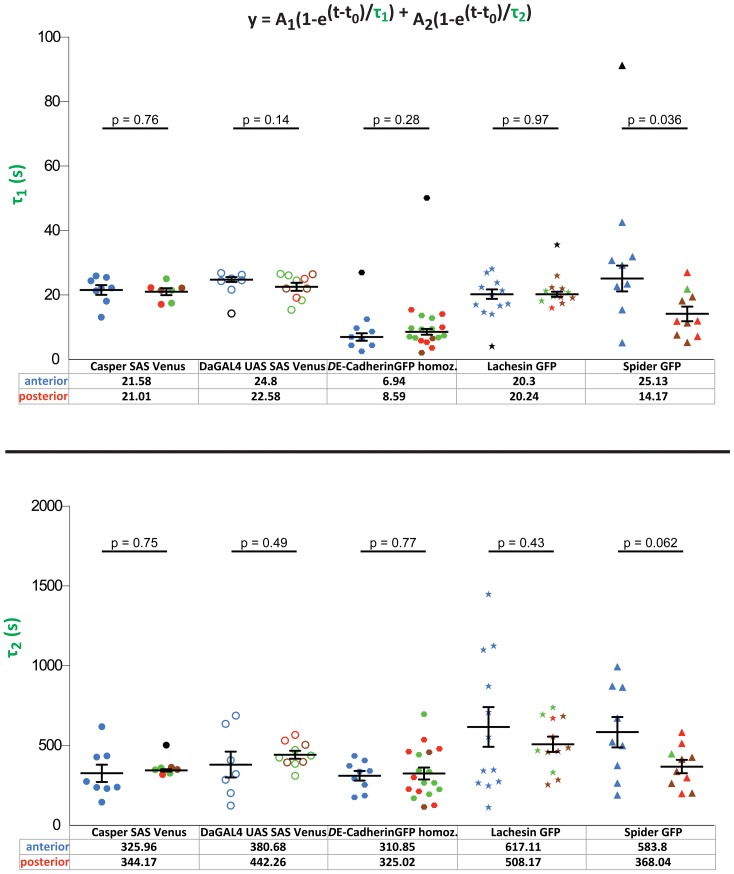
Figure 4. Kinetic values of all membrane markers in wild-type embryos.
τ1 mean values and τ2 mean values with corresponding error bars (mean ± SEM) in both anterior and posterior regions of wild-type embryos. All membrane markers and their different conditions are shown. Each point refers to a different experiment. The values in the bottom refer to the mean value of the kinetic parameter assessed in both the anterior and posterior regions of the embryo. Note the difference in order of magnitude of the two kinetic parameters. Blue refers to movies performed in the anterior. Green refers to movies performed in the dorsal posterior, brown to movies in the ventral posterior, red to movies where it was not possible to establish whether they were dorsal or ventral and black to outliers identified by the MATLAB script. The significance values (p-values) between every condition are pointed out in the figure.

