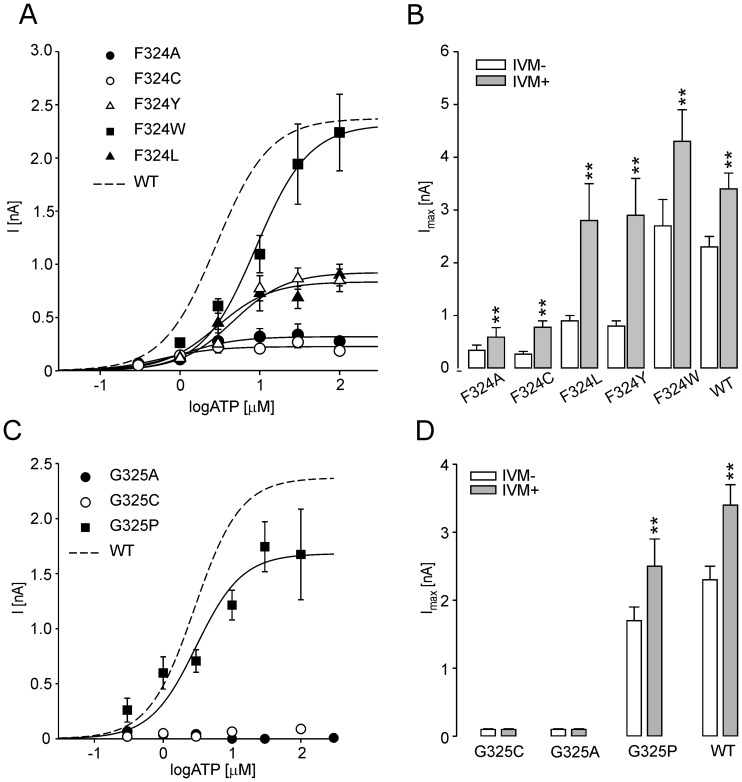
Figure 4. The effects of the F324 and G325 mutations on rP2X4R function.
(A) The ATP-concentration response curves for the single point mutants at position F324. (B) The Imax values of the F324 mutants measured in the absence (white bars) and presence (gray bars) of IVM. (C) The concentration-response curve for the rP2X4-G325P (symbols) and WT receptor (dotted line). (D) The Imax values of G325 mutants measured in the absence (white bars) and in the presence (gray bars) of IVM. The mean ± SEM values from 7–23 cells per mutant are shown; **p<0.01 between IVM-untreated (-IVM) and -treated (+IVM) receptors.

