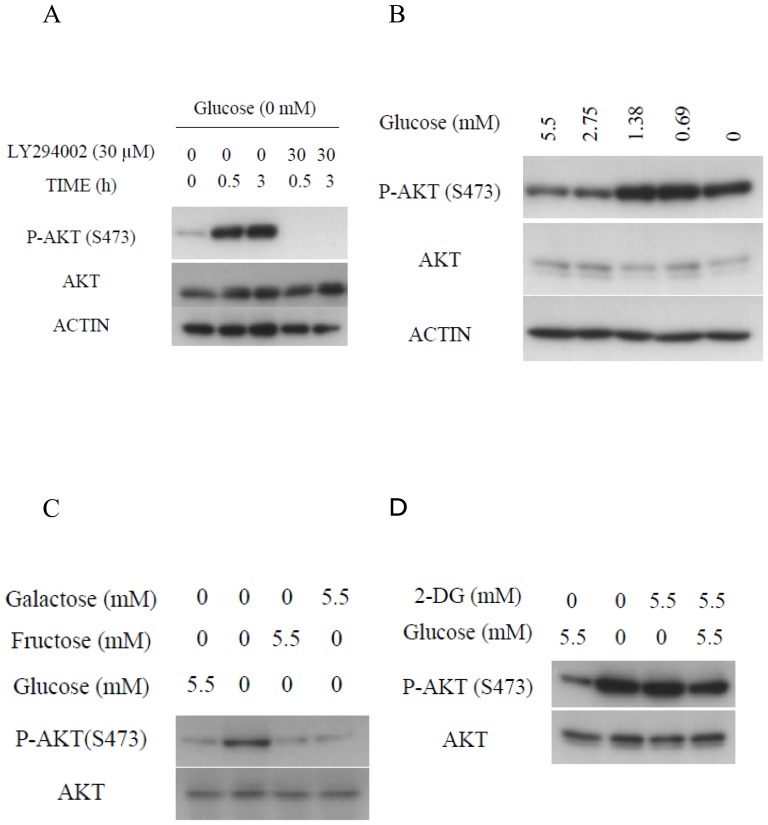
Figure 1. AKT phosphorylation was induced under glucose deprivation.
(A) Immunoblotting analyses after incubation of HepG2 cells in the absence or presence of 5.5 mM of glucose and absence or presence of 30 µM of LY294002 for the indicated times. (B) HepG2 cells treated or not treated with various concentrations of glucose for 0.5 h were subjected to immunoblotting. (C) Immunoblotting analyses of HepG2 cells treated or not treated with 5.5 mM of glucose, 5.5 mM of galactose, or 5.5 mM of fructose for 0.5 h. (D) Immunoblotting analyses of HepG2 cells treated or not treated with 5.5 mM of glucose, 5.5 mM of 2-DG, or 5.5 mM of glucose plus 5.5 mM of 2-DG for 0.5 h.

