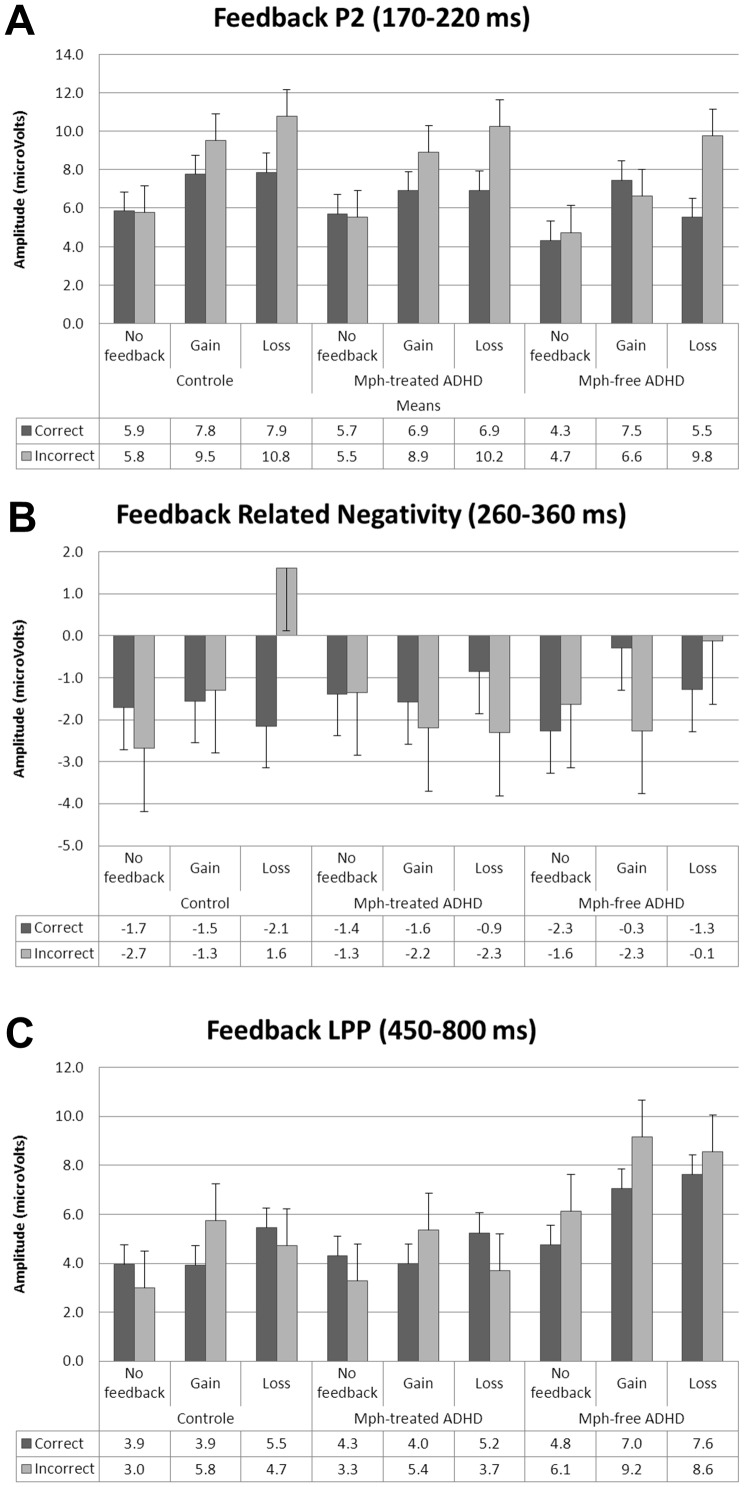
Figure 3. Bar graphs of the feedback-locked ERP amplitudes.
Mean amplitudes of the Feedback P2 (A), Feedback Related Negativity (FRN) (B), and feedback Late Positive Potential (C) of the typically developing (TD), Mph-treated ADHD, and Mph-free ADHD groups for correct and incorrect trials in the three feedback conditions (no feedback, gain and loss). Error bars indicate standard errors.

