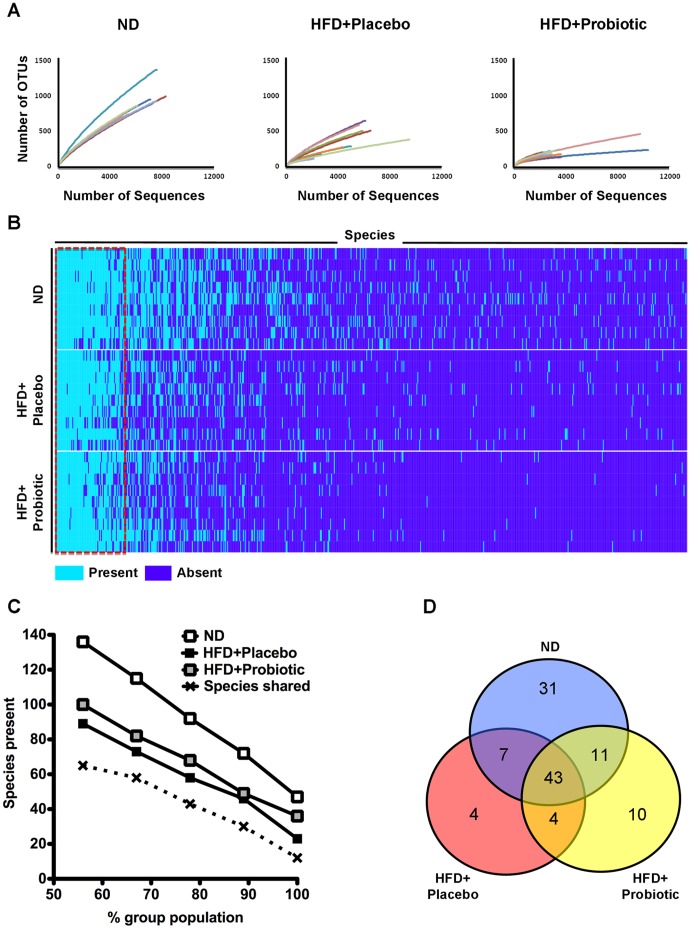
Figure 2. Shared microbiota and species diversity.
(A) Rarefaction analysis of 151,061 pyrosequencing reads of 16S rRNA from feces using OTUs at a 97 percent sequence similarity cut-off value. (B) Microbiota species present or absent in ND, HFD+placebo and HFD+probiotic mice. Dark blue indicates species absent in the gut microbiota, light blue indicates species present in the gut microbiota. (C) Shared microbiota within and between groups varies depending on the percent group population cut-off used to define the shared microbiota. (D) Venn diagram of overlap in species shared by >78 percent of the mice from each group.

