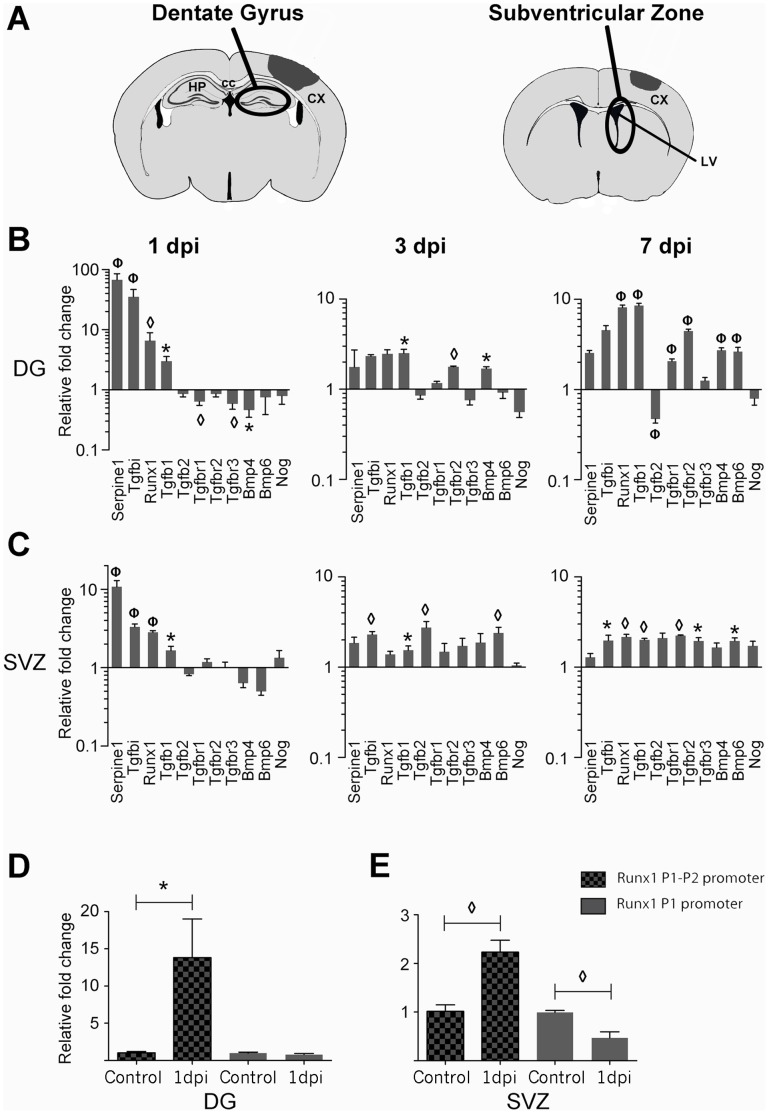
Figure 1. Cortical brain injury increases mRNA expression of TGF-β and BMP related molecules in the adult neurogenic areas.
(A) Brain diagrams show the approximate area of the lesion penumbra at −1.82 mm from bregma for DG and +0.26 mm for SVZ, (adapted from Paxinos & Franklin, 2007). (B, C) QPCR analysis with TGF-β related PCR arrays indicates changes in RNA expression of specific genes at different times after CCI injury in either the DG (B) or the SVZ (C). Graphs (log10 scale) show genes whose expression was significantly altered by injury (n = 3± s.e.m.). (D, E) Runx1 mRNA expression is significantly increased at 1 and 7 dpi in both regions and is specifically upregulated in the DG (D) and SVZ (E) at 1 dpi when measured by P1–P2 primers, but not by P1 primers (n = 3± s.e.m.). Gene expression is displayed as the relative fold change in mRNA levels as compared to the level in control animals. *p<0.05, ◊ p<0.01, Φ p<0.001. Abbreviations: dentate gyrus (DG), subventricular zone (SVZ), cortex (CX), corpus callosum (CC), hippocampus (HP), lateral ventricle (LV), and days post-injury (dpi).

