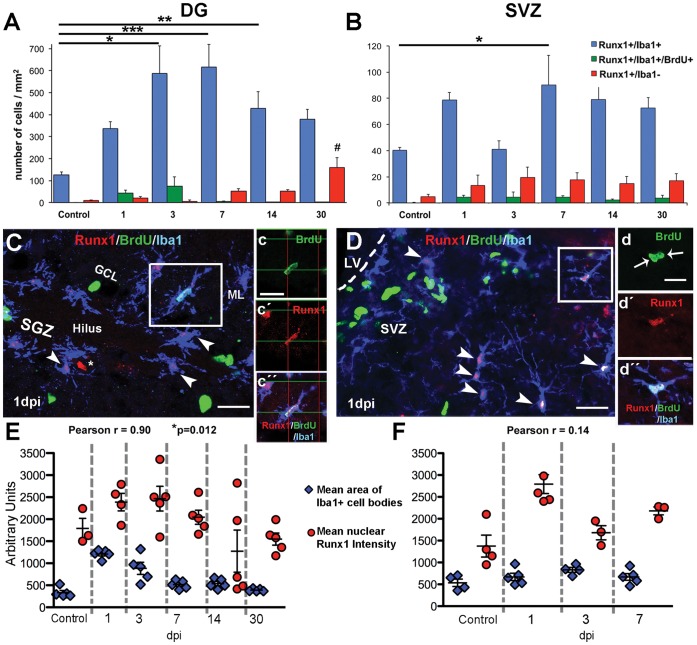
Figure 3. Runx1 is expressed predominantly in microglia after CCI injury in the neurogenic regions of the adult mouse.
(A, B) The number of Runx1+ cells/mm2 identified as Iba1+ microglia (blue bars), Iba1+ microglia incorporating BrdU (green bars), or Iba1− cells (red bars) are shown in the DG and SVZ. No Iba1+ cell proliferation was observed in control animals. Asterisk indicates statistically significant difference as compared to control Runx1+/Iba1+ cell counts and number symbol indicates difference as compared to control Runx1+/Iba1− cell counts. *p<0.05, **p<0.01 ***p<0.001, and #p<0.01. n = 5± s.e.m. (C, D) Confocal micrographs of triple labeling for Runx1 (red), Iba1 (blue), and BrdU (green) positive hypertrophic microglia in the DG (C and insets c, c′, c′′) and intermediate microglia in the SVZ (D and insets d, d′, d′′) at 1 dpi. Arrowheads denote Runx1+ microglia (C, D), and an asterisk (C) denotes a non-microglial, Runx1+ cell. Scale bars for C and D = 50 µm; for c and d = 20 µm. (E, F) Graphs show the mean area of Iba1+ cell body (total pixels) and mean Runx1 immunoreactivity (pixel intensity) at different time points post-injury and in control in the DG (E) and SVZ (F). Each point represents combined data from one animal. Abbreviations: subventricular zone (SVZ), dentate gyrus (DG), granule cell layer (GCL), subgranular zone (SGZ), molecular layer (ML), lateral ventricle (LV), and days post-injury (dpi).

