Figure 2.
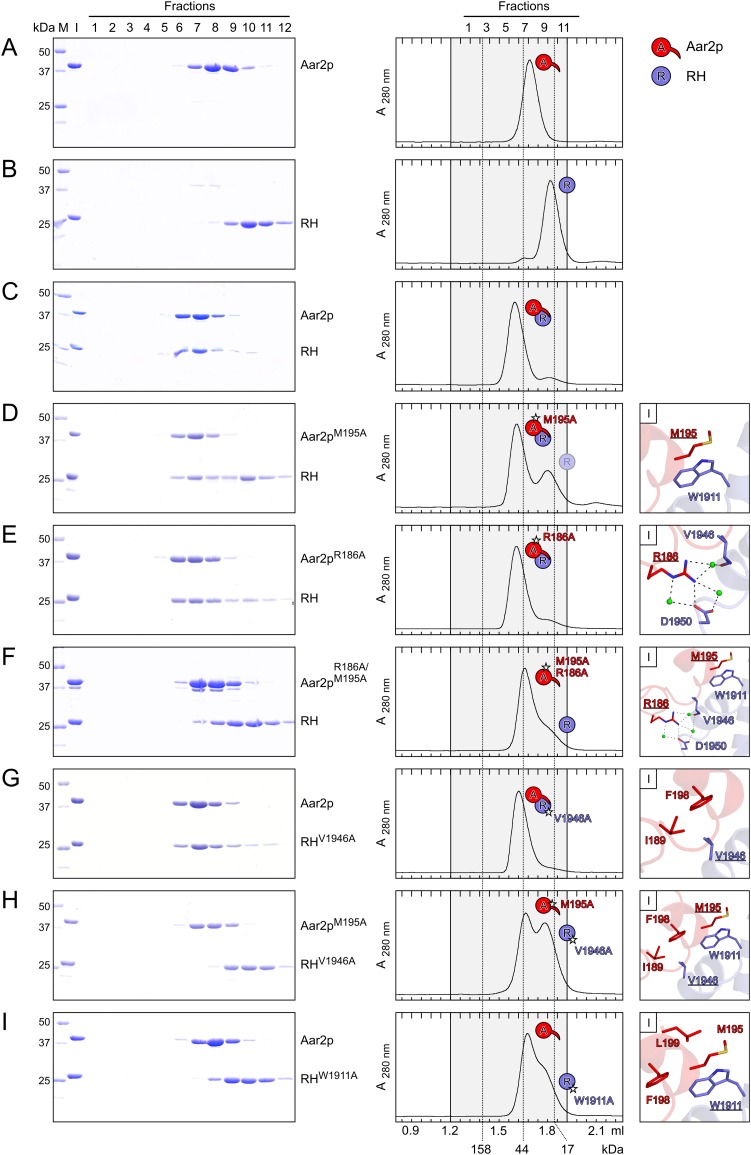
Alanine-scanning mutagenesis probing the Aar2p–RH interaction. (A–I) Gel filtration analyses assessing the interaction between Aar2p and RH and mutant variants. A–C are identical to Supplemental Figure S4, A–C. All mutated residues contribute to interface I (Fig. 1C). (Left) SDS-PAGE analysis of the eluted gel filtration fractions (indicated at the top of A). The first two lanes show the protein standard (M) and the gel filtration input (I). Molecular mass of the standard proteins in kilodaltons are shown on the left, and protein names are on the right. (Middle) Elution profiles of the respective gel filtration runs. Fractions corresponding to the SDS-PAGE analysis are highlighted in gray, fraction numbers are shown at the top of A, and elution volumes are at the bottom of I. Dashed lines across the elution profiles indicate the elution peaks of molecular mass standards (molecular masses are given at the bottom). Icons denote single proteins or complexes and are defined above the middle panels. Stars denote point mutations. Transparent icons represent an excess of the respective protein running separate from the complex. (Right) Close-up views on the mutated residues (underlined) and their interactions across the Aar2p–RH interface.

