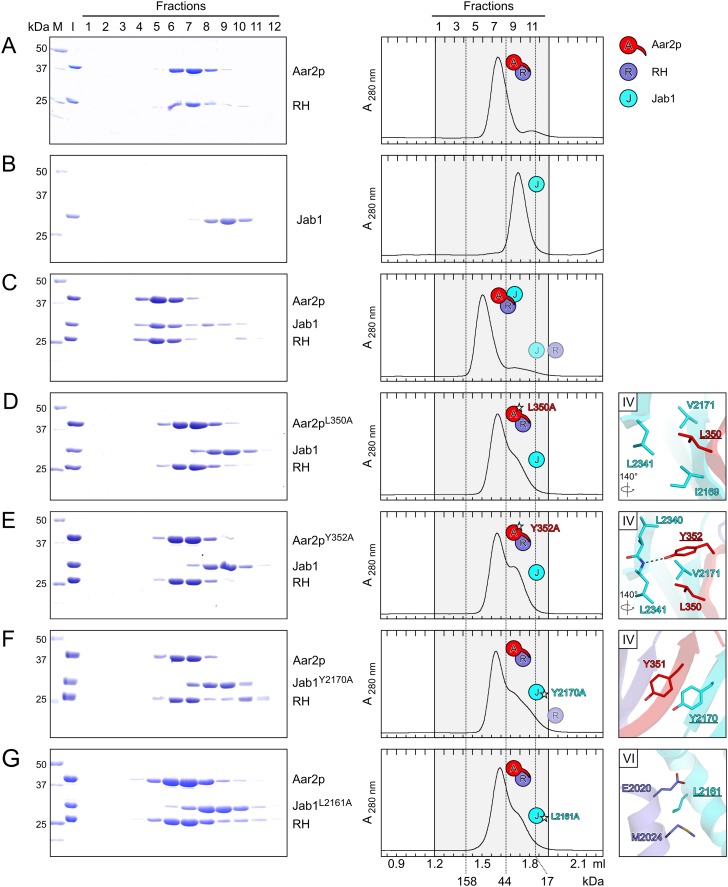
Figure 3.
Alanine-scanning mutagenesis probing the Aar2p–Jab1 and RH–Jab1 interfaces. (A–G) Gel filtration analyses assessing the interaction between the Aar2p–RH complex and Jab1 and variants. A is identical to Figure 2C. Roman numerals in the panels on the right identify the respective interface (Fig. 1C). Other details and labels are as in Figure 2. Icons representing the proteins are defined in the top right. Rotation symbols indicate the views relative to Figure 1B.

