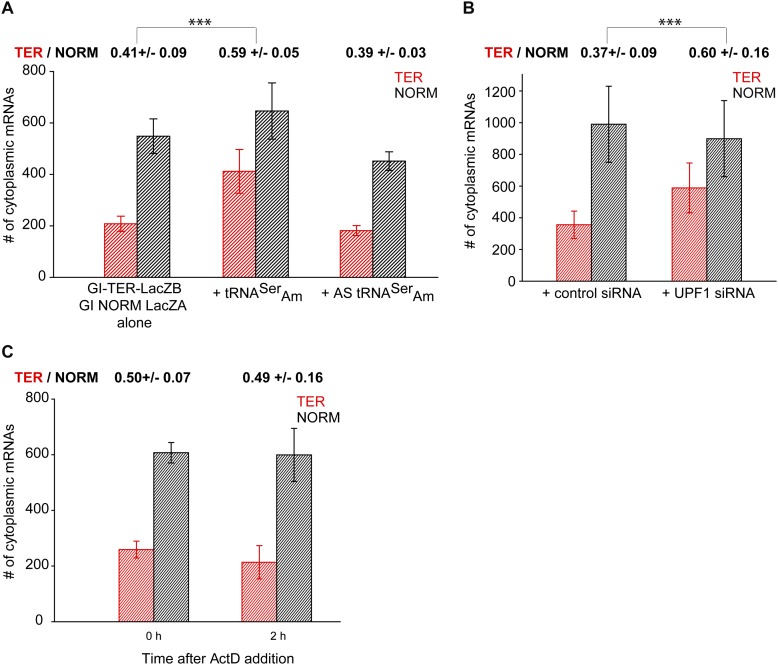
Figure 3.
The steady-state level of cytoplasmic Gl TER mRNA depends on PTC recognition and UPF1 and is resistant to NMD. (A) U2OS Tet-On cells were transfected with the bidirectional promoter plasmid expressing GI TER and NORM mRNAs alone or with a plasmid expressing either tRNASerAm, which suppresses recognition of the PTC codon, or antisense tRNASerAm, which does not suppress recognition of the PTC codon. The nuclear boundary was segmented using the DAPI staining as described (Fig. 2). For each condition, the number of cytoplasmic TER mRNAs (red histograms) and NORM mRNAs (black histograms) was quantified at the equatorial plane of an image stack. DAPI was used for nuclear segmentation. The expression of TER and NORM mRNAs was analyzed in 21 untreated cells, 16 cells coexpressing tRNASerAm and 11 cells coexpressing AS tRNASerAm. (B) Bidirectional promoter plasmid carrying NORM and TER genes was transfected into U2OS Tet-On cells expressing either UPF1 siRNA or a control siRNA (de Turris et al. 2011). At steady state, NORM and TER mRNAs were counted as described above in 17 control siRNA-expressing and 14 UPF1 siRNA-expressing cells. (C) Transcription of TER and NORM mRNAs was induced as described in A. Afterward, cells were fixed (0 h) or treated with ActD for 2 h to stop transcription (2 h). The number of cytoplasmic TER and NORM mRNAs was counted as described above. Twenty and 12 cells were analyzed at 0 h and 2 h, respectively. In A–C, histograms represent the average number of TER and NORM mRNAs per cell ±SEM. The ratio of TER and NORM mRNAs is provided above the histograms. To determine this ratio, the ratio between TER and NORM mRNAs was first determined for each individual cell, after which an average ratio ±SEM for 21, 16, or 11 cells in A, 17 and 14 cells in B, and 20 and 12 cells in C was calculated. (***) t-test with P < 0.001.

