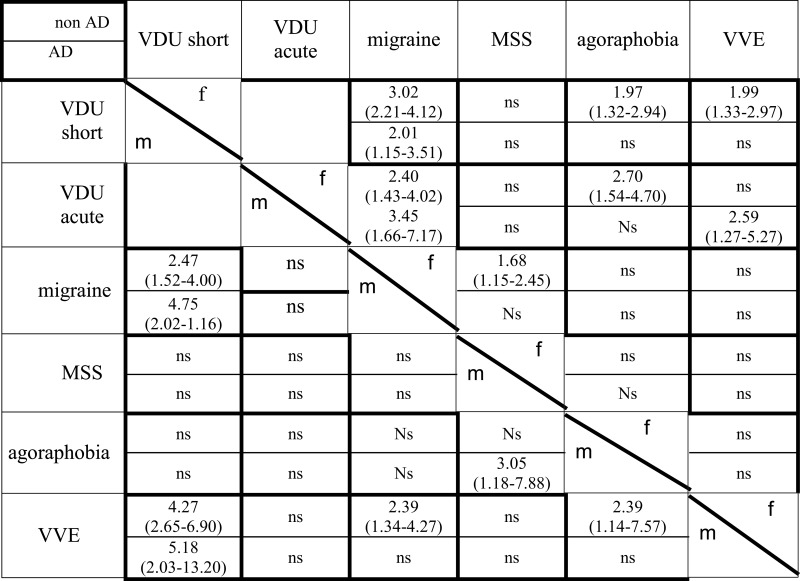
Table 6.
VDU and co-morbidities controlled for gender and anxiety-depression.
 |
The upper part of each cell shows data for non-AD, the lower for AD participants. Data for men under diagonal line and for women above. AD, anxiety-depression; VVE, vaso-vagal episodes; MSS, motion sickness susceptibility; VDUshort, composite score of VDU symptoms ≤ 1 h; VDUacute, composite score of VDU symptoms > 1 h.
