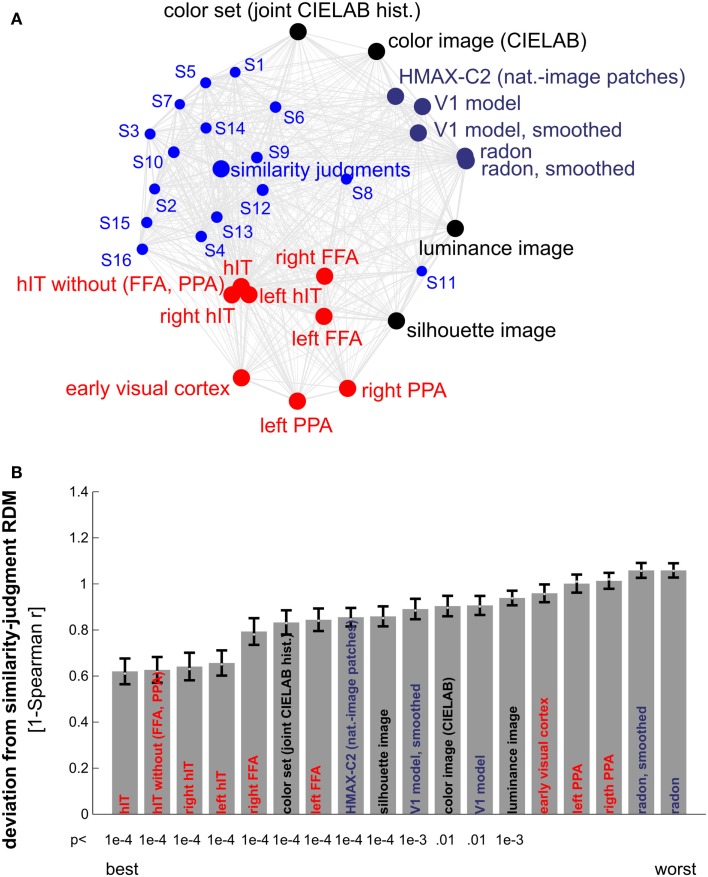
Figure 10.
Similarity judgments’ match to brain and model representations. (A) Multidimensional scaling of similarity representations (criterion: metric stress, distance measure: 1-r, where r is Spearman correlation coefficient). The MDS plot visualizes the relationships between multiple RDMs simultaneously. Text-label colors indicate the type of similarity representation: red indicates brain-activity, blue indicates human similarity judgments, black indicates simple computational models, and gray/blue indicates complex computational models. Single-subject similarity judgment RDMs are shown as well (smaller font). The gray connections between the RDMs reflect the inevitable distortions induced by arranging the higher-dimensional similarity representations in a lower-dimensional space (2D). (B) Match bars for several brain regions and models showing their deviation from the subject-average similarity judgment RDM. The deviation is measured as 1 − Spearman correlation between RDMs. Text color encodes the type of representation as in (A). Error bars indicate the standard error of the deviation estimate. The standard error was estimated as the standard deviation of 100 deviation estimates obtained from bootstrap resamplings of the condition set. The p-value below each bar indicates whether the associated RDM is significantly related to the similarity judgment RDM (stimulus-label randomization test, 10,000 randomizations). hIT is the best match to the similarity judgments.

