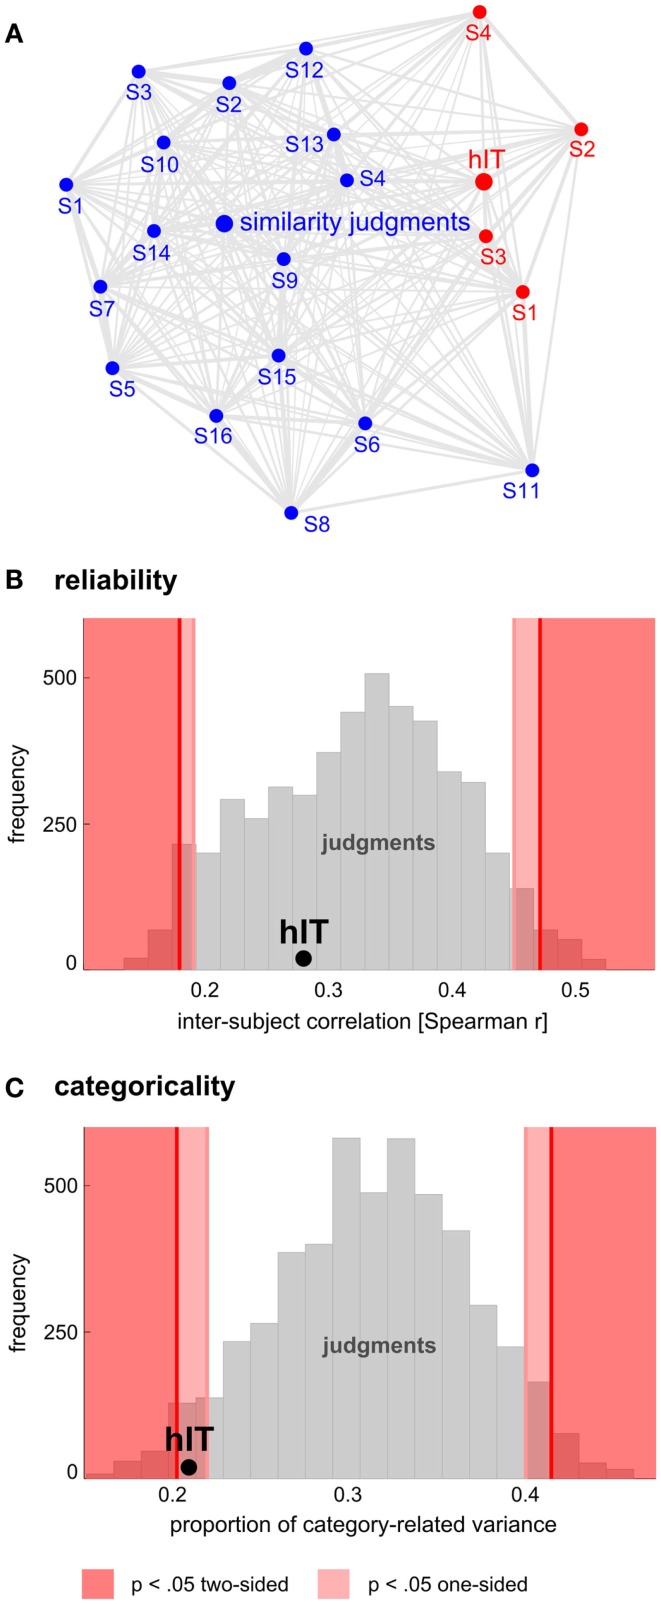
Figure 11.
Human judgments show similar reliability but stronger categoricality than human IT. (A) Multidimensional scaling of single-subject similarity representations (criterion: metric stress, distance measure: 1-r, where r is Spearman correlation coefficient). The MDS plot visualizes the relationships between multiple RDMs simultaneously. Text-label colors indicate the type of similarity representation: red indicates human IT, blue indicates human similarity judgments. Subject-average RDMs are shown in larger font. The gray connections between the RDMs reflect the inevitable distortions induced by arranging the higher-dimensional similarity representations in a lower-dimensional space (2D). Visual inspection of the MDS plot suggests that variability across subjects is similar for judgments and hIT. (B) This panel shows inter-subject reliability for hIT and judgments. We estimated inter-subject reliability as the average pairwise inter-subject RDM correlation (Spearman r), using sets of four subjects (one set for hIT; 5,000 randomly selected subsets for the judgments). The hIT reliability falls well within the judgment distribution, indicating that hIT and judgments do not significantly differ in terms of reliability. (C) This panel shows categoricality for hIT and judgments. We estimated categoricality as the proportion of dissimilarity variance explained by the category-model (Figure 5B), averaged across sets of four subjects (one set for hIT; 5,000 randomly selected subsets for the judgments). Note that we fitted the model after accounting for any difference in reliability between judgments and hIT. The hIT categoricality falls within the bottom 5% of the judgment distribution, which indicates that the judgments are more categorical than the hIT representation.

