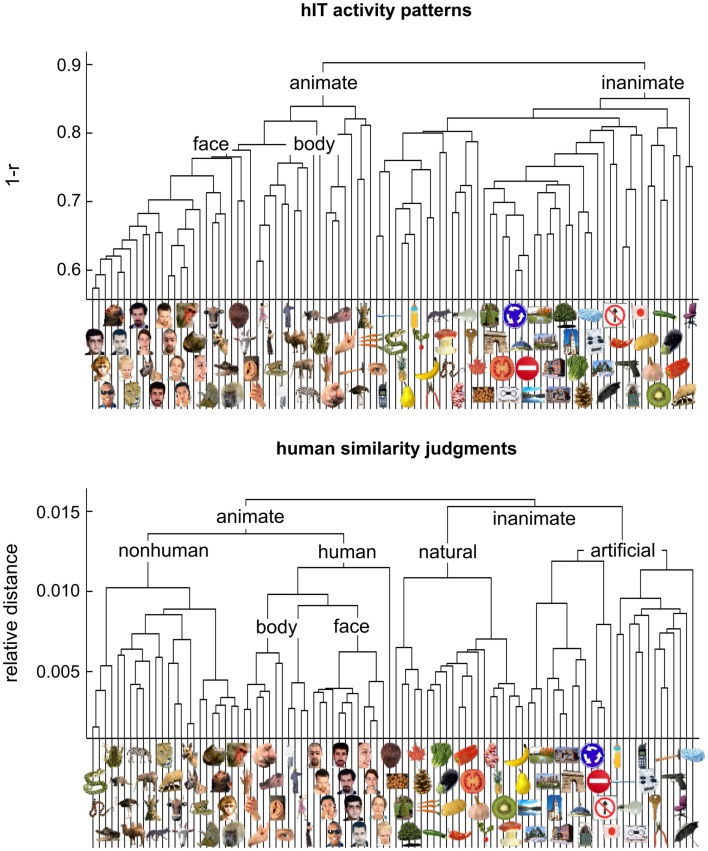
Figure 4.
Hierarchical clustering for human IT and human judgments. hIT object-activity patterns have been shown to cluster according to natural categories (top panel) (Kriegeskorte et al., 2008b). In order to assess whether human object-similarity judgments show a similar categorical structure, we performed hierarchical cluster analysis on the similarity judgments (bottom panel). Hierarchical cluster analysis starts with single-image “clusters” and successively combines the two clusters closest to each other to form a hierarchy of clusters. The vertical height of each horizontal link reflects the average dissimilarity between the stimuli of two linked subclusters. hIT activity-pattern dissimilarity was measured as 1-r (where r is Pearson correlation coefficient), judged dissimilarity was measured as relative Euclidean distance (using the MA method). Text labels indicate the major clusters. Both hIT activity patterns and human similarity judgments cluster the objects according to natural categories and show a top-level animate/inanimate division. However, the human similarity judgments introduce additional categorical divisions.

