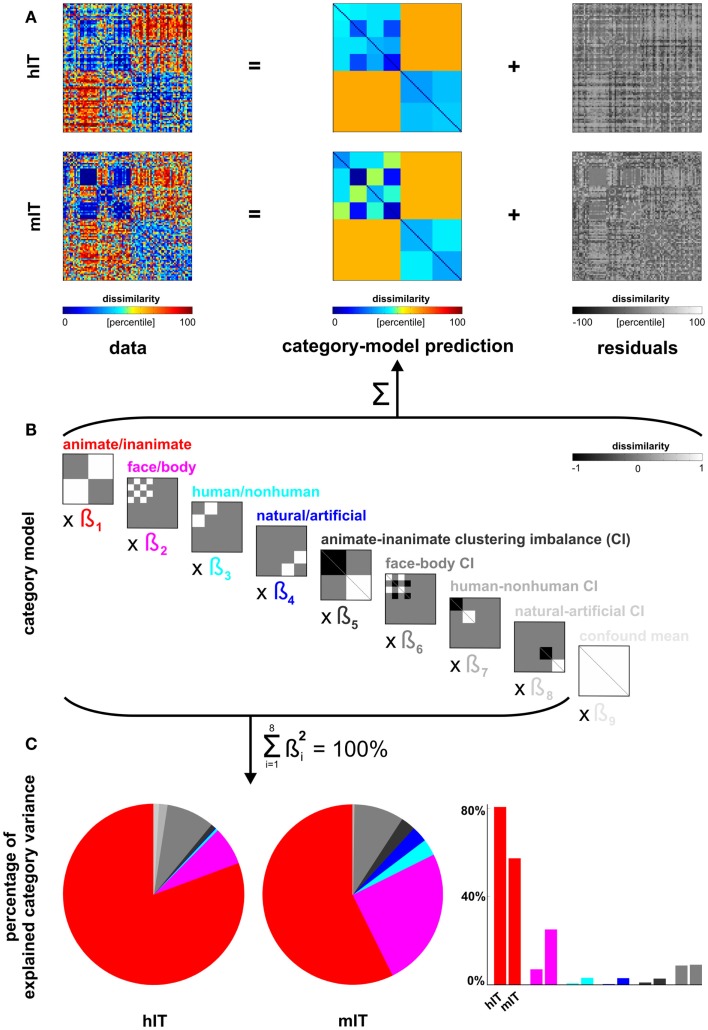
Figure 6.
Categorical divisions in human IT and monkey IT. We used the linear model from Figure 5 (repeated in (B) for convenience) also to compare the IT representations between human and monkey [same data as in Kriegeskorte et al. (2008b) for both species; a more in-depth analysis of the monkey data is Kiani et al. (2007)]. (A,B) The proportion of residual variance was greater in mIT than hIT. Residual variance was therefore equated by adding noise to the hIT matrix (which is therefore not identical to Figure 5). (C) Descriptively, the animate/inanimate and face/body divisions are prominent in both hIT and mIT and the human/non-human and natural/artificial divisions less so. Monkey IT might emphasize the animate/inanimate division less and the face-body division more relative to human IT. However, we could not perform the randomization test of Figure 5 here, because there were only two monkey subjects. For further inferential analyses comparing hIT, mIT, and human judgments, see Figure 7.

