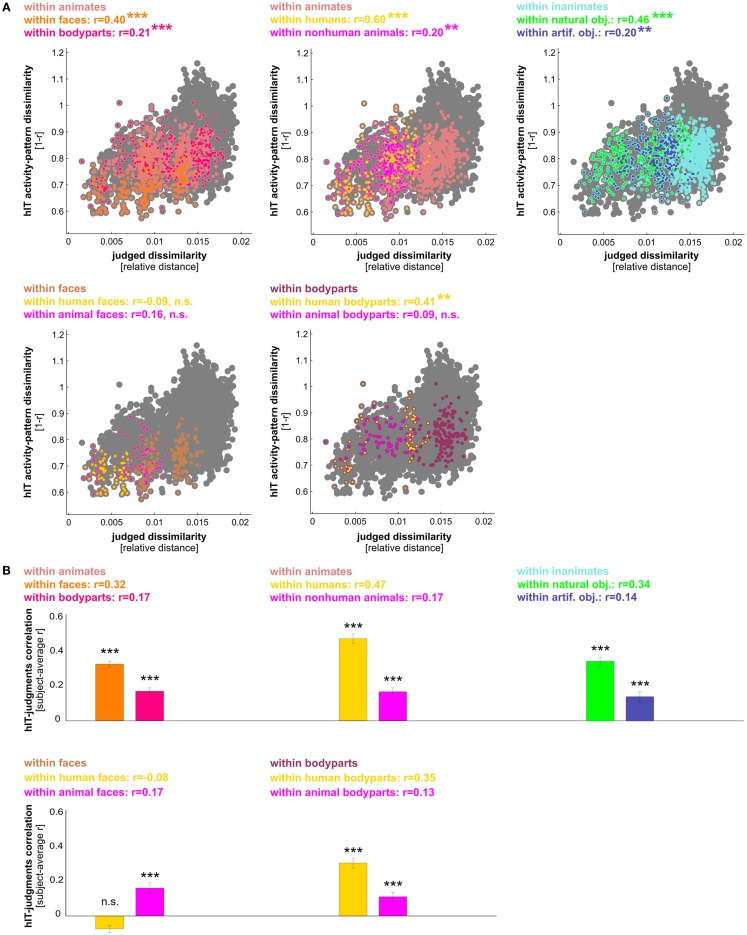
Figure 9.
hIT activity-pattern dissimilarities and judged dissimilarities are significantly correlated within most finer-grained category subsets of images. (A) Scatter plots of hIT and judged dissimilarities taken from the subject-average RDMs in Figure 3A. A dot is placed for each stimulus pair based on its hIT activity-pattern dissimilarity and judged dissimilarity. The large gray dots represent all possible stimulus pairs, the smaller colored dots placed on top of the gray dots code for subsets of images as indicated in the plot legends. Plot legends show Spearman correlation coefficients and associated p-values computed with a one-sided stimulus-label randomization test (10,000 randomizations). Asterisks indicate significance (*** = p < 0.001, ** = p < 0.01). The hIT and judgment similarity structures are significantly correlated within the following subsets of images: faces, bodies, human bodies, humans, non-human animates, natural objects, and artificial objects. This suggests a shared within-category similarity structure. (B) The within-category match between hIT activity-pattern dissimilarities and judged dissimilarities generalizes to the population of similarity judgment subjects. We computed the correlation of each single-subject similarity judgment RDM with the subject-average hIT RDM and tested whether the average of those correlations was significantly larger than zero, using a one-sample t test. Bars show the average correlation between hIT and judged dissimilarities across subjects. Error bars show SEM. Asterisks indicate significance (p < 0.001).

