
Figure 3. Stationary distribution of cooperators in a FCW.
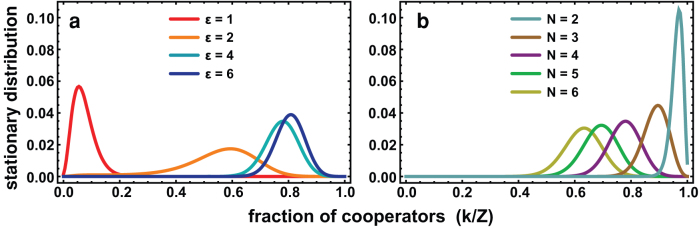
In a) we used the same game parameters as in Fig. 1a and added a mutation probability of μ = 0.01. The more prompt individuals are at removing adverse ties (higher ε), the easier it is for Cs to overcome the coordination barrier. In b) we assess the dependence of the prevailing fraction of cooperation on the group size N.