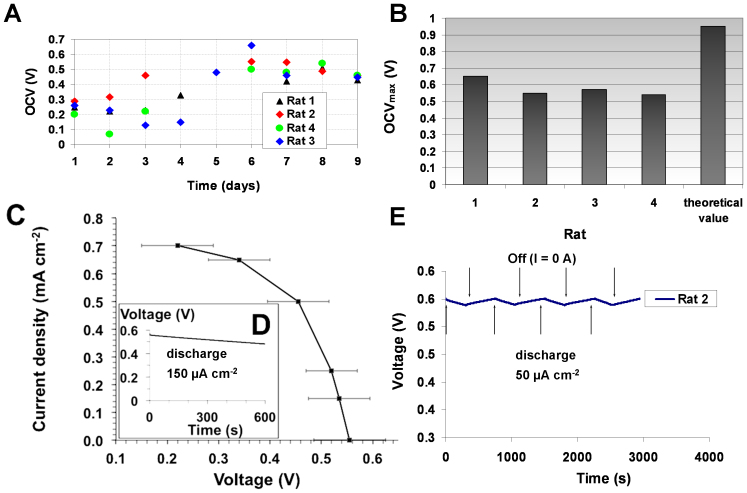
Figure 2. Electrochemical characteristics of the implanted biofuel cell.
(A) Evolution of OCV over time for 4 implanted GBFCs (B) Maximum OCVs recorded after 6–8 days; (C) Current versus average voltage. Potential values measured after 300 s of constant current discharges in the range 150–700 μA cm−2. (D) Voltage dependence over time under continuous discharge of 150 μA cm−2 (E) Evolution of the GBFC voltage during 4 discharge and stabilization cycles, using each time 50 μA cm−2 discharge current for 5 minutes.

