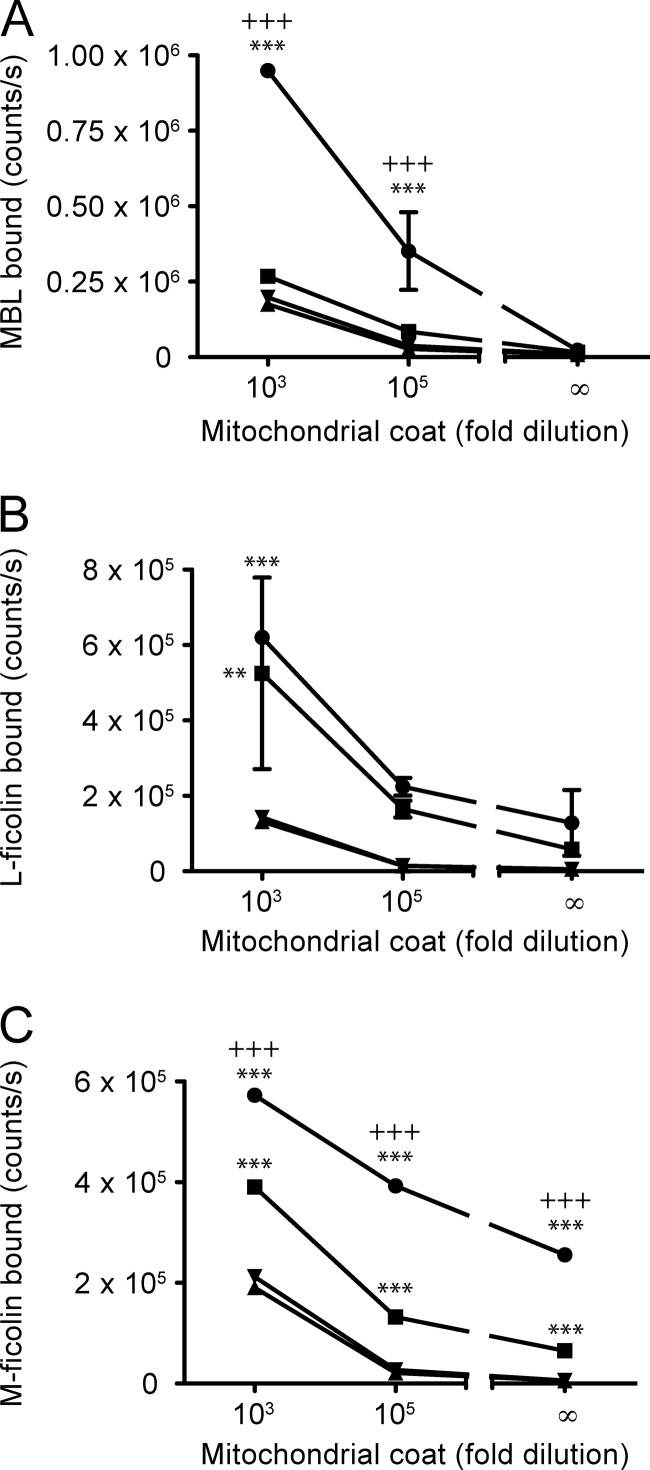
FIGURE 2.
Binding of MBL and ficolins to mitochondria coated in microtiter wells. A, analysis of the binding of MBL in microtiter wells coated with two different concentrations of mitochondria or blocking buffer only. ●, MBL at 1 μg/ml in calcium-containing buffer; ■, MBL at 1 μg/ml in EDTA-containing buffer; ▴, calcium buffer only; ▾, EDTA buffer only. B, as in panel A, but for L-ficolin. C, as in panel A, but for M-ficolin. Error bars indicate S.D. of duplicate measurements. A and C, representative of three independent experiments. B, representative of two independent experiments. Significant p values are indicated for two-way ANOVA using Bonferroni's post test, when comparing mitochondrial coat with background for each buffer (*) or comparing mitochondrial coat with the two different buffers (+). Significance levels are defined as: ** or ++ < 0.01, and *** or +++ < 0.001.

