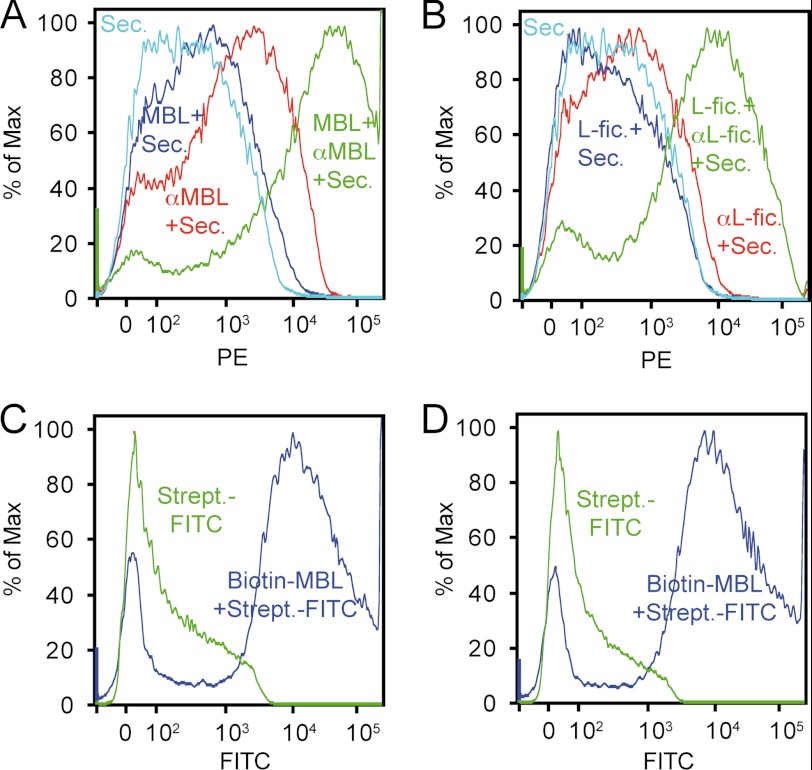
FIGURE 4.
Flow cytometric analysis of binding of MBL and L-ficolin to mitochondria. A, binding of MBL to mitochondria detected with anti-MBL followed by phycoerythrin (PE)-labeled secondary rabbit F(ab′)2 anti-mouse immunoglobulins (MBL + αMBL + Sec., green line), omitting MBL (αMBL + Sec., red line), omitting anti-MBL (MBL + Sec., dark blue line), or secondary antibody only (Sec., light blue line). % of Max, percentage of maximum. B, as in panel A, but for L-ficolin (L-fic.). C, binding of biotinylated MBL to mitochondria purified from BALB/c mice, detected with streptavidin-FITC (Biotin-MBL Strept.-FITC, blue line) versus streptavidin-FITC alone (Strept.-FITC, green line). D, as in panel C, but for mitochondria purified from MBL/RAG2 knock-outs.

