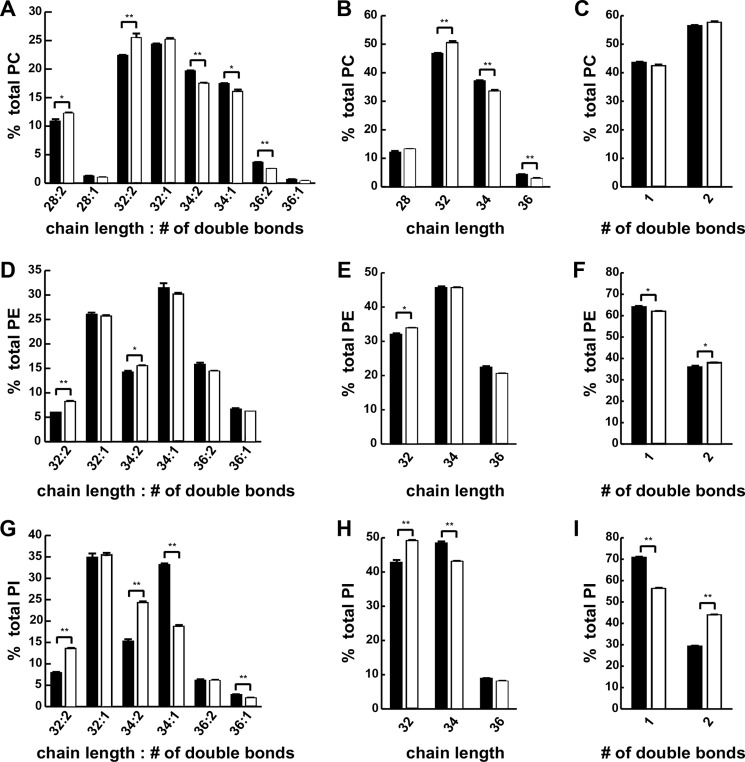
FIGURE 4.
An HSD induced changes in phospholipid fatty acid length and saturation. Wandering third instar FBs were isolated from larvae reared on control or 0.7 m sucrose HSD and subjected to ESI-MS analyses. A–C, phosphatidylcholine composition. D–F, phosphatidylethanolamine composition. G–I, phosphatidylinositol composition. An unpaired, two-tailed t test was used to derive p values. *, p < 0.05; **, p < 0.01. Error bars are ±S.E.

