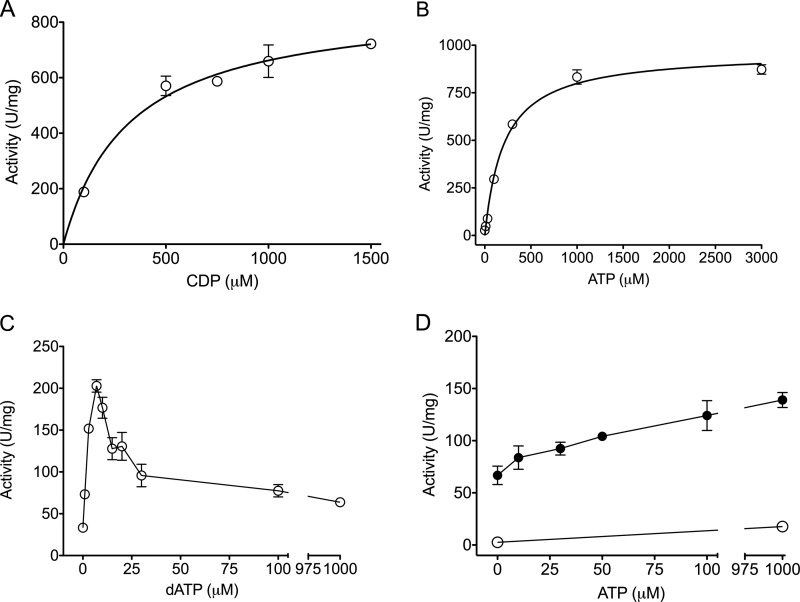
FIGURE 3.
Activity assay results showing the allosteric properties of the D. discoideum class I RNR. CDP reduction (A–C) and GDP reduction (D) are shown. A, titration of substrate CDP (100–1500 μm) in the presence of the allosteric effector ATP. B, titration of the positive effector ATP (0–3000 μm). C, titration of the inhibiting allosteric effector dATP (0–1000 μm). D, ATP titration (0–1000 μm) in the absence (○) and presence (●) of 2 mm dTTP. Mean values with error bars displaying ranges are shown. For details, see “Experimental Procedures.”

