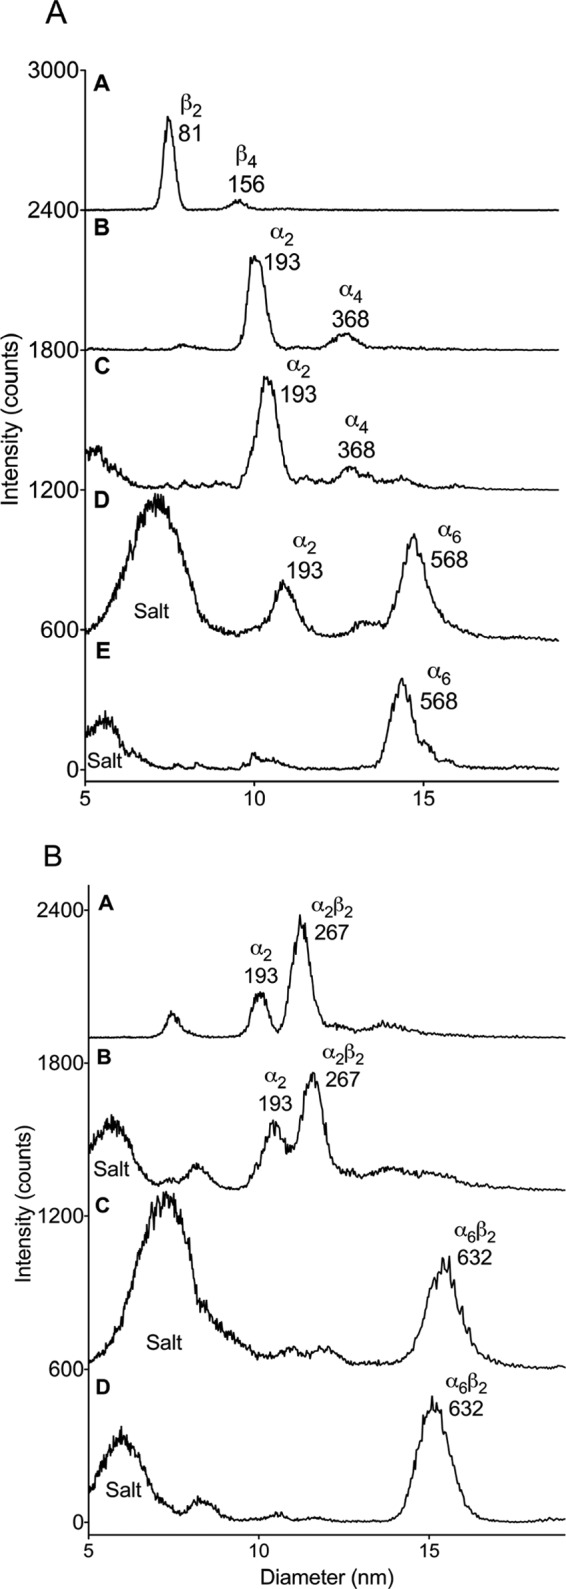
FIGURE 4.

GEMMA data of the separate D. discoideum NrdA and NrdB proteins (A) and NrdA and NrdB mixtures (B) with and without allosteric effectors. The indicated numbers show experimental molecular masses in kDa. The NrdA concentration was 0.04 mg/ml, the NrdB concentration was 0.02 mg/ml, and all effector concentrations were 50 μm in combination with 50 μm Mg2+ ions. The base lines have been shifted by 600–700 intensity counts for each trace. A, NrdB (trace A), NrdA (trace B), NrdA + dTTP (trace C), NrdA + ATP (trace D), and NrdA + dATP (trace E). B, NrdA + NrdB (trace A), NrdA + NrdB + dTTP (trace B), NrdA + NrdB + ATP (trace C), and NrdA + NrdB + dATP (trace D).
