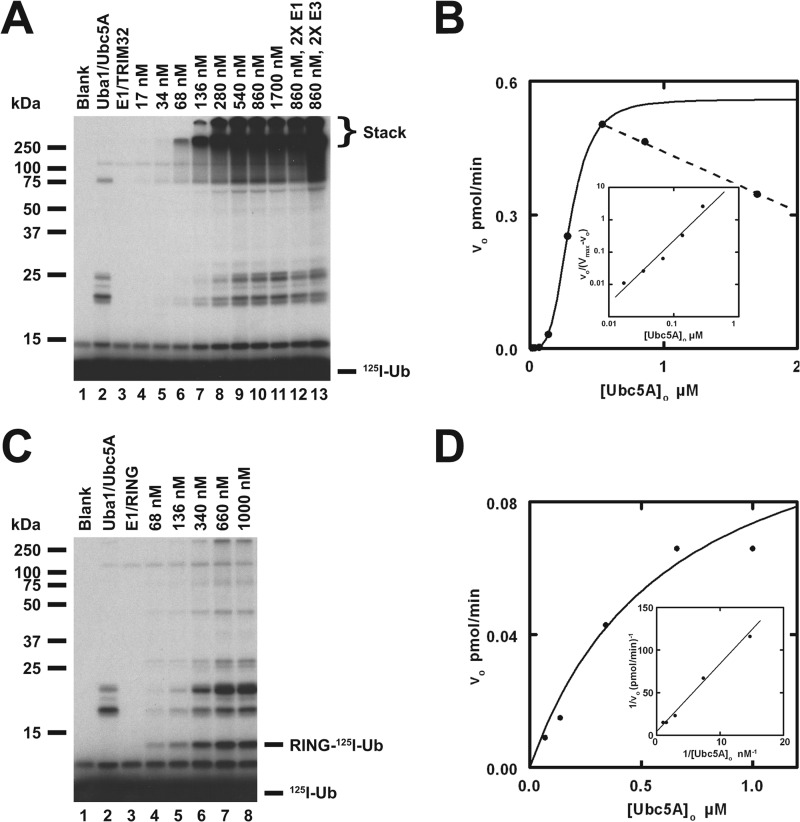
FIGURE 4.
TRIM32 exhibits cooperativity with respect to [Ubc5A]o. A, autoradiogram of the dependence of TRIM32-catalyzed 125I-ubiquitin chain formation on [Ubc5A]o (lanes 4–11). To verify that reactions were E3 limiting, E1 and E3 concentrations were doubled in lanes 12 and 13, respectively, whereas holding the E2 concentration at 860 nm. Reactions contained 44 nm Uba1, the indicated concentrations of Ubc5A, and 80 nm TRIM32 protein, as indicated. The position of the 5% stacking gel and free 125I-ubiquitin are shown to the right. B, plot of the initial velocity of chain formation (the band in the stacking gel from panel A) versus [Ubc5A]o. The sigmoidal curve is a nonlinear least squares fit to the Hill equation of the data from lanes 4–9, prior to the observed substrate inhibition in lanes 10 and 11. The sigmoidicity of the plot is verified by the linearity of the corresponding Hill plot (inset). The substrate inhibition observed above 540 nm is indicated by the dashed line. C, autoradiogram of the dependence of RING domain-catalyzed auto-125I-monoubiquitination on [Ubc5A]o (lanes 4–8). Reactions contained 72 nm Uba1, the indicated concentrations of active Ubc5A, and 9.4 μm RING domain protein, as indicated. The positions of the 5% stacking gel, RING-125I-ubiquitin, and free 125I-ubiquitin are shown on the right. The RING domain was generated prior to the assays by thrombin cleavage (20 IU of thrombin in 230 μl containing 118 μm GST-RING fusion protein for 30 min at room temperature). D, plot of the initial velocity of RING auto-125I-monoubiquitination versus [Ubc5A]o. The hyperbolic shape of the curve was verified by the linearity of the double-reciprocal plot in the inset. The hyperbolic curve was derived by nonlinear least squares fit to the data in lanes 4–8, using GraFit (Erithacus Software Ltd.).

