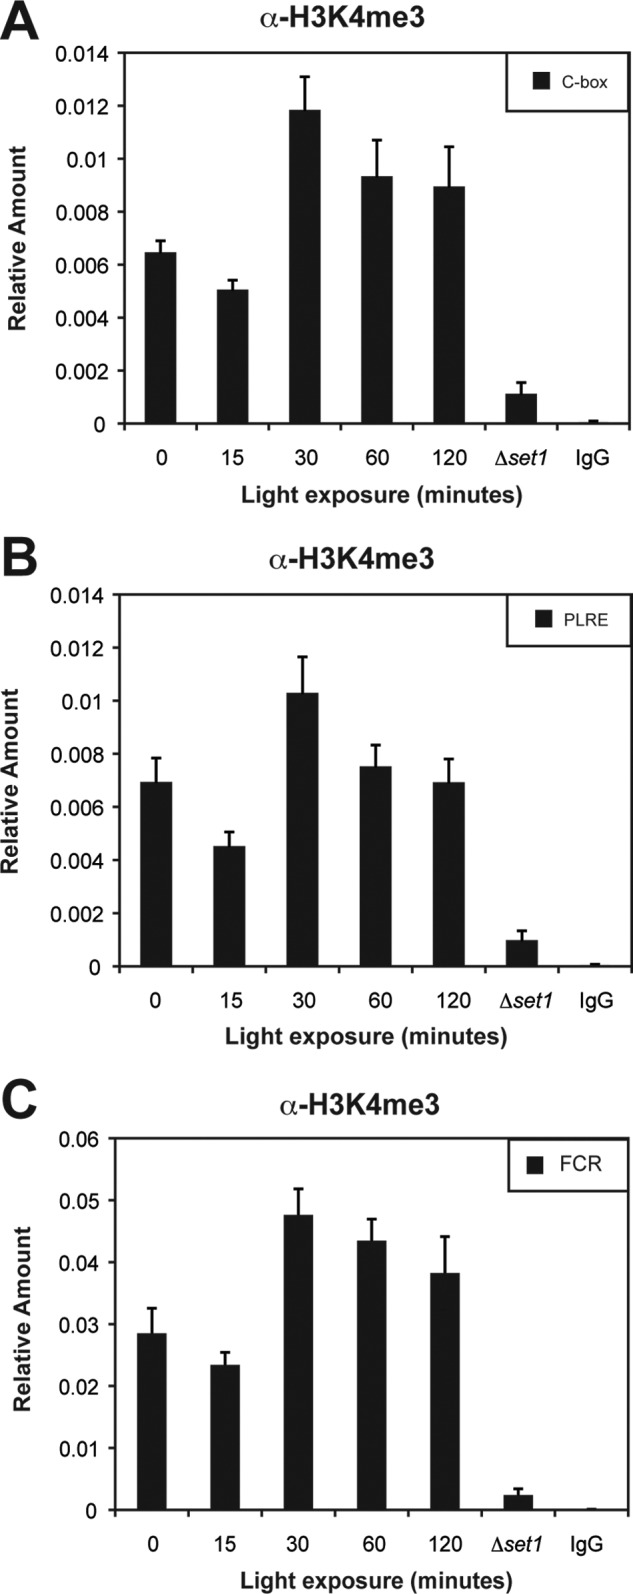
FIGURE 6.

H3K4me3 under light-induced conditions. H3K4me3 within the frq locus was examined by ChIP after light induction at the C-box (A), PLRE (B), and within FCR (C). The amount of DNA associated with H3K4me3 was determined by quantitative PCR at the indicated times in the light. Sheared chromatin from Δset1 and a nonspecific IgG were used as controls. Average values are from four independent experiments. The errors bars represent the S.E.
