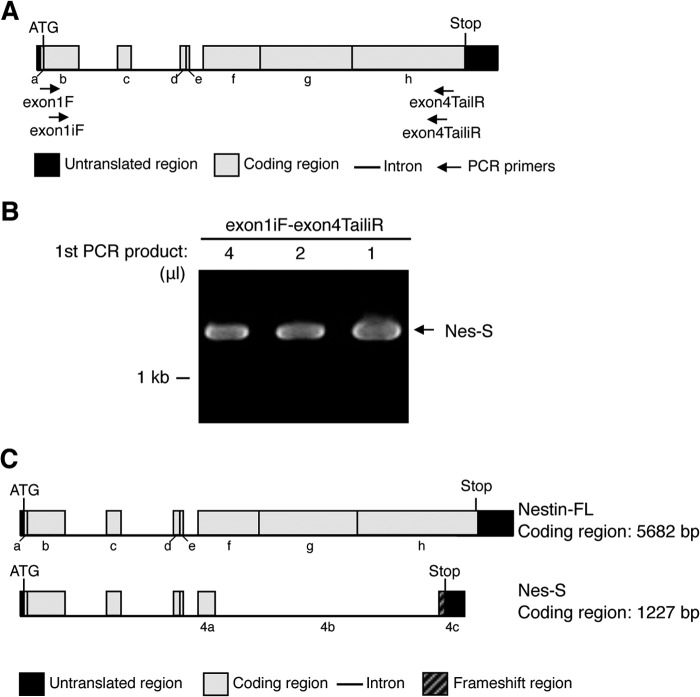
FIGURE 2.
Identification of the Nes-S transcript variant in DRG neurons by RT-PCR. A, schematic diagram showing locations of the primers used to identify the complete cDNA of Nes-S. The coding regions of rat nestin gene were designated as regions from a to h. B, nested RT-PCR of DRG neuron RNA. The nested RT-PCR was performed using the primer set exon1F-exon4TailR and followed with the primer set exon1iF-exon4TailiR. A specific 1.3-kb band was produced. C, upper panel, schematic diagram of the nestin-FL. Lower panel, schematic diagram of the splicing pattern of the 1.3-kb band, which was named as Nes-S.

