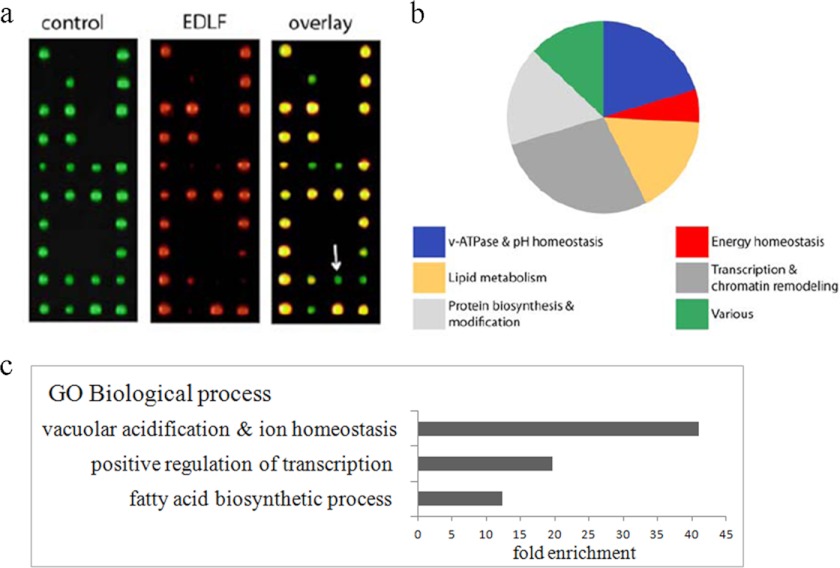
FIGURE 1.
High throughput edelfosine S. cerevisiae-sensitive screen. a, complete set of haploid S. cerevisiae yeast deletion mutants (∼4800 strains) was arrayed onto 20 plates and robotically pinned onto SD media (computerized colored green colonies) or SD + edelfosine (computerized colored red colonies). Putative edelfosine-sensitive mutants led to the formation of smaller colonies (or no colony) when grown on edelfosine-containing media (green on overlay, arrow). b, functional distribution of the 54 genes found to cause sensitivity to edelfosine when deleted. The functional categories corresponding to vacuolar acidification and ion transport, grouped as V-ATPase and pH homeostasis in the figure, had the lowest p values (2.784e-12 and 3.099e-08, respectively, Funspec analysis) indicative of a significant enrichment. c, enrichment of genes in our dataset clustering according to gene ontology (GO). Enrichment is calculated relative to the frequency of that cluster in the whole genome.

