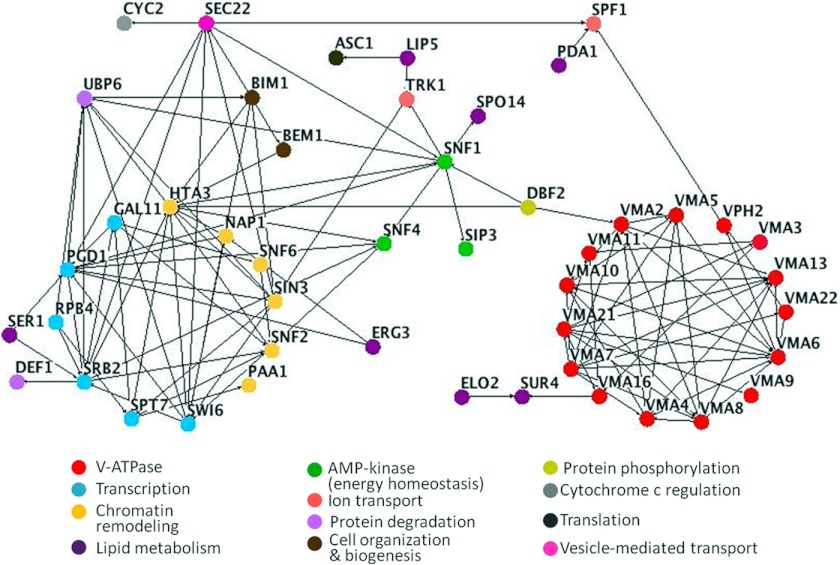
FIGURE 2.
Interactome map of genes identified in edelfosine-sensitive screen. Nodes represent genes identified as hypersensitive to edelfosine in our screen. Genes belonging to the same pathway or complex are colored according to the categories shown at the bottom of the figure. Edges indicate experimentally determined genetic or physical interactions. Nodes with a minimum of one connection are shown.

