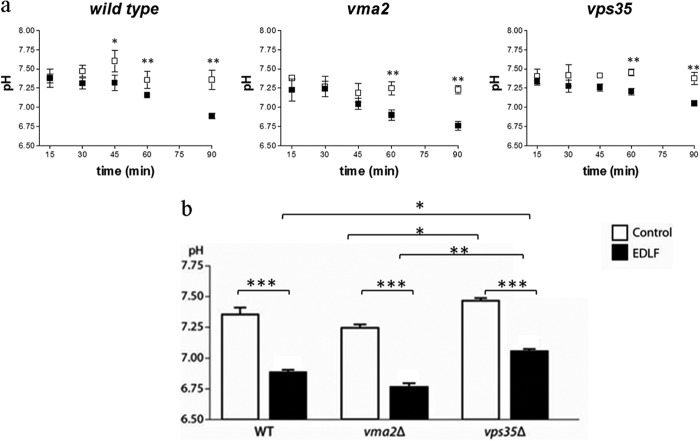
FIGURE 4.
Edelfosine treatment leads to intracellular acidification. Cytosolic pH measurements were performed using pHluorin, as described under “Experimental Procedures.” a, intracellular pH was monitored during a 90-min period in control (open squares) or edelfosine (19 μm)-treated cells (closed squares). Time course is shown for wild type (BY4741), the resistant retromer mutant vps35Δ, and the hypersensitive V-ATPase mutant vma2Δ. b, comparison of the values obtained after a 90-min treatment. Data shown are mean values ± S.D. representative of three independent experiments. Asterisks indicate values that are significantly different from untreated control cells as follows: ***, p < 0.001; **, p < 0.01; *, p < 0.05.

