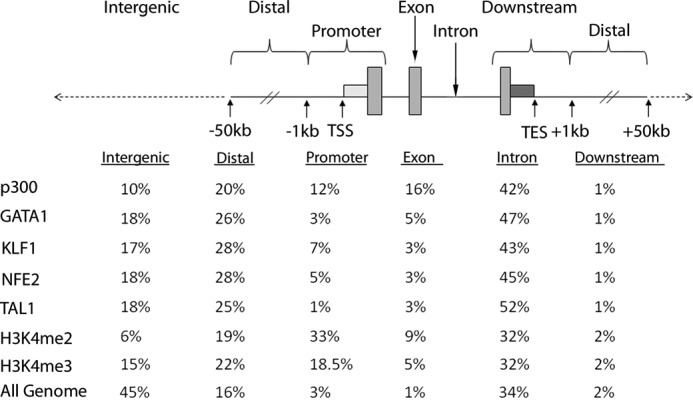
FIGURE 1.

Distribution of p300 and erythroid transcription factor occupancy in human primary erythroid cell chromatin. The human genome was portioned into six bins relative to RefSeq genes. The data below represent the percentage of the human genome represented by each bin and the distribution of the p300 and erythroid transcription factor binding sites in each bin. TES, transcriptional end site.
