
FIGURE 2.
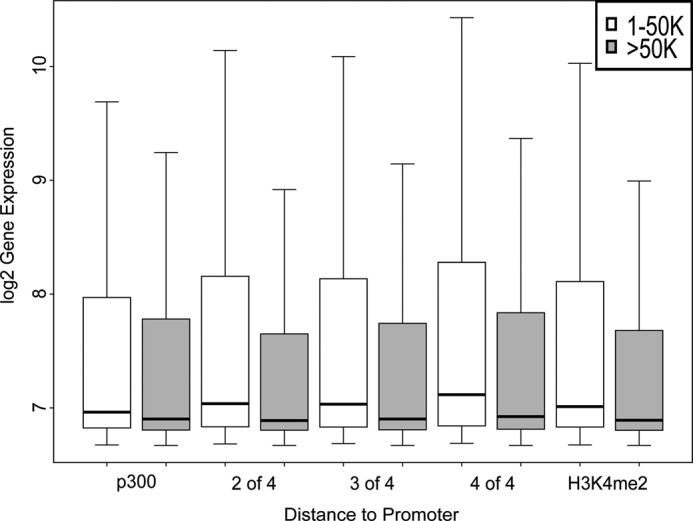
Gene expression and p300 and erythroid transcription factor occupancy in human primary erythroid cells. Gene expression levels were determined in primary human erythroid cell mRNA using Illumina microarrays. Expression levels of genes with p300 and erythroid transcription factor binding sites between 1 and 50 kb from the transcription start site (white boxes) were compared with the expression levels of genes with binding sites >50 kb away (gray boxes). Combinations of the four erythroid transcription factors studied (any two of the four, any three of the four, and all four) are shown. Error bars, S.D.