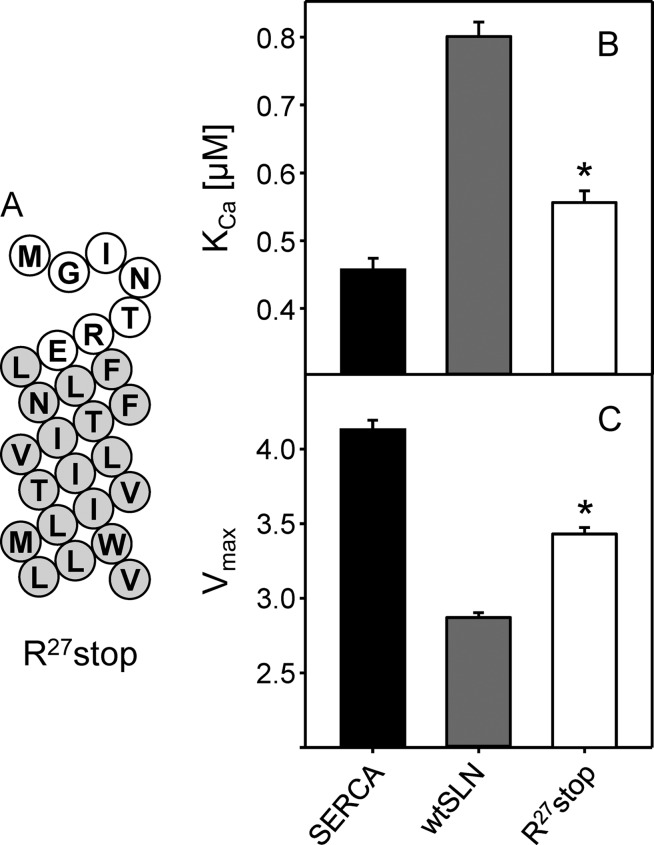
FIGURE 4.
Removing the luminal tail of SLN. A, topology model for Arg27stop SLN (white, cytosolic residues; gray, transmembrane residues). KCa (B) and Vmax (C) values were determined from ATPase activity measurements for SERCA in the absence and presence of Arg27stop SLN. Each data point is the mean ± S.E. (error bars) (n ≥ 4). The Vmax, KCa, and nH are given in Table 1. Asterisks indicate comparisons against SERCA in the absence and presence of wild-type SLN (p < 0.05).

