
FIGURE 6.
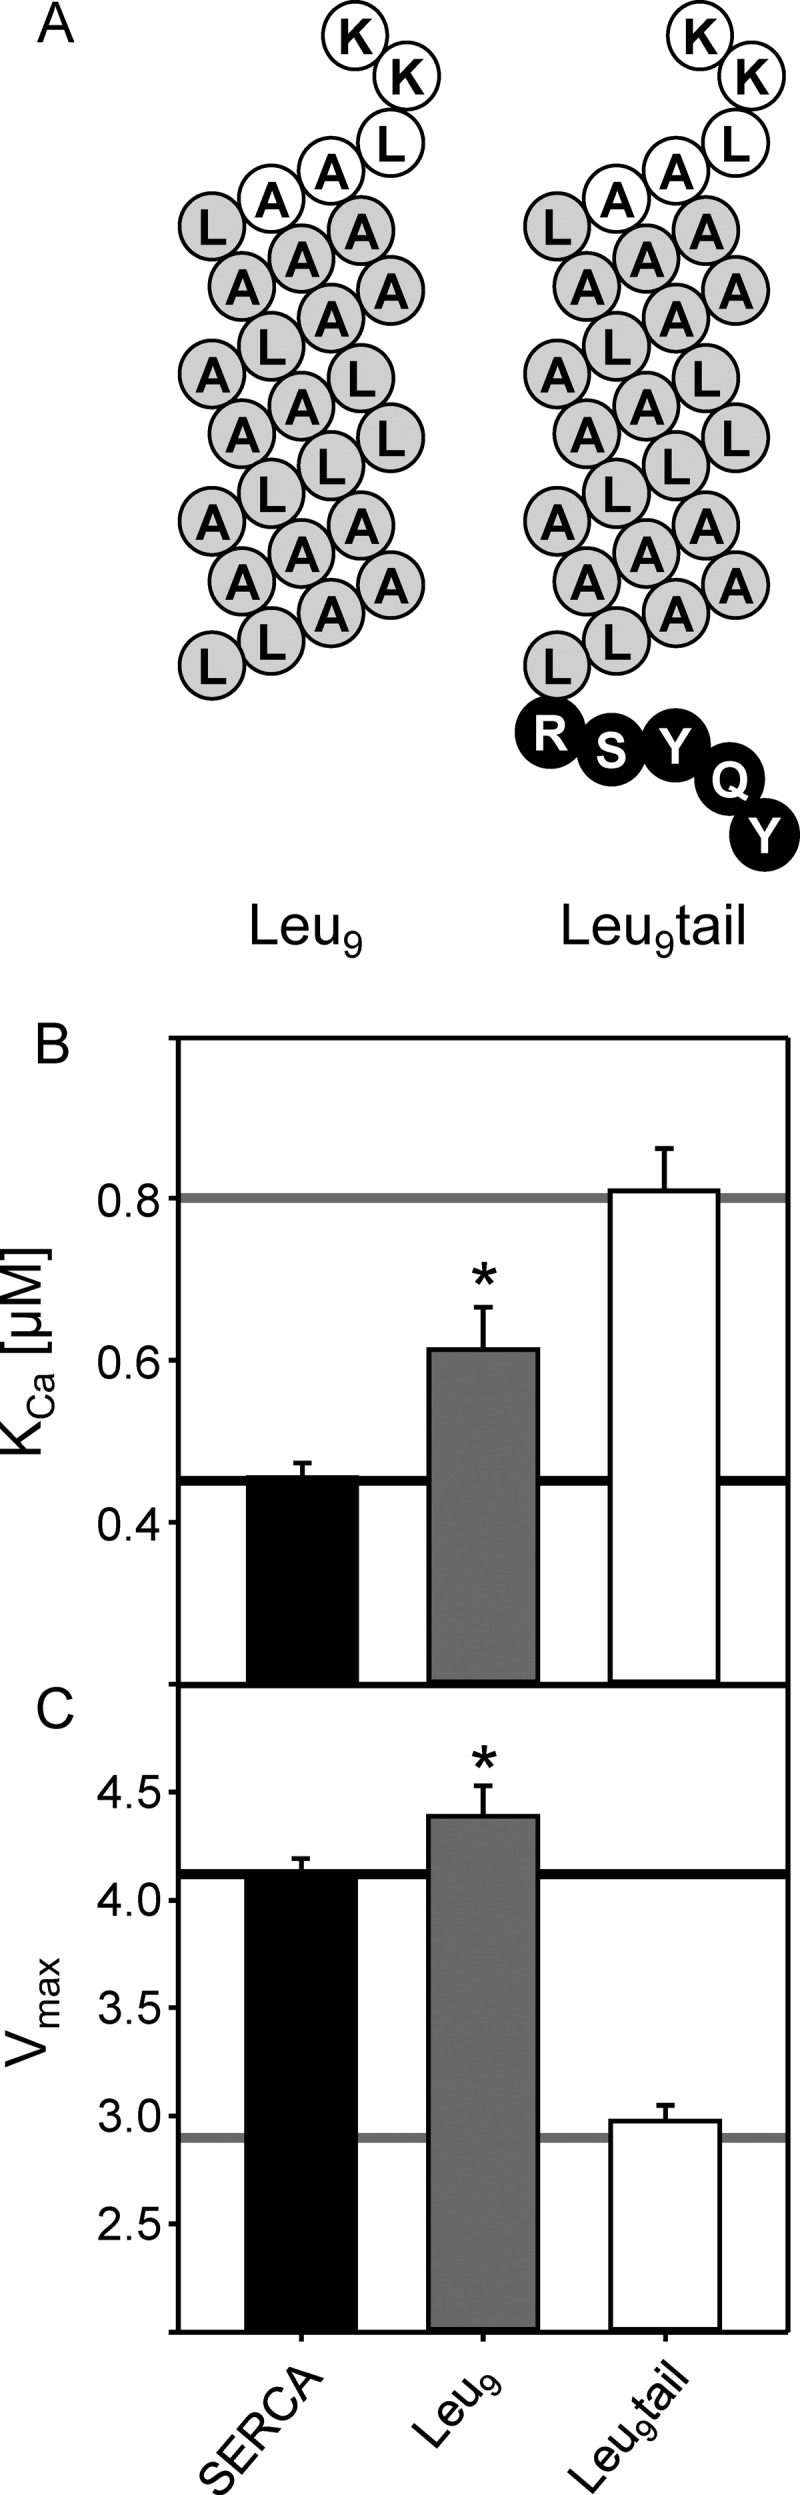
Transferring the luminal tail of SLN to a generic transmembrane helix. A, topology model of Leu9 and Leu9tail (white, cytosolic residues; gray, transmembrane residues; black, luminal residues). KCa (B) and Vmax (C) values were determined from ATPase activity measurements for SERCA in the absence and presence of Leu9 and Leu9tail. For comparative purposes, the black lines indicate the values for SERCA alone, and the gray lines indicate values for SERCA in the presence of wild-type SLN. Notice that Leu9tail closely recapitulates wild-type SLN. Each data point is the mean ± S.E. (error bars) (n ≥ 4). The Vmax, KCa, and nH are given in Table 1. Asterisks indicate comparisons against wild-type SLN (p < 0.05).