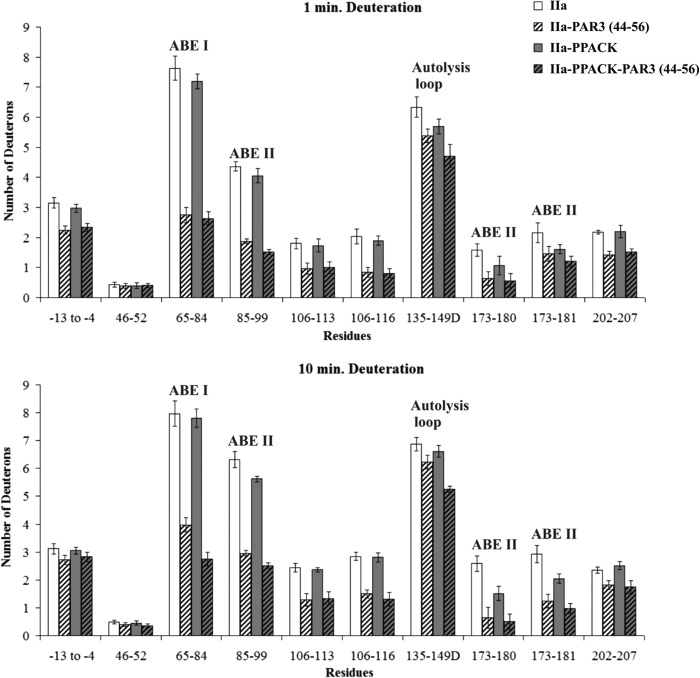
FIGURE 6.
Deuterium incorporation for the PAR3(44–56)-thrombin complex in the presence and absence of PPACK. The bars in the graphs correspond to deuterium incorporation of free thrombin (white), PAR3(44–56)-bound (striped white), PPACK-inhibited thrombin (gray), and the ternary IIa-PPACK-PAR3(44–56) complex (gray striped). Values for both 1 and 10 min of deuteration are displayed. The error bars correspond to standard deviations for three independent trials.

